AI solutions
What we do
Services
Experts in
How we work
Rainforest Connection is a software that combines loT and machine learnings to protect the rainforest.
Main goals of Rainforest Connection:
Our client has gathered an array of audio recordings — varying in length between a few minutes and a few days — from forests and seas around the globe.
These recordings are used to identify the sounds of different animals and find out more about their living areas, populations, migration patterns, etc.
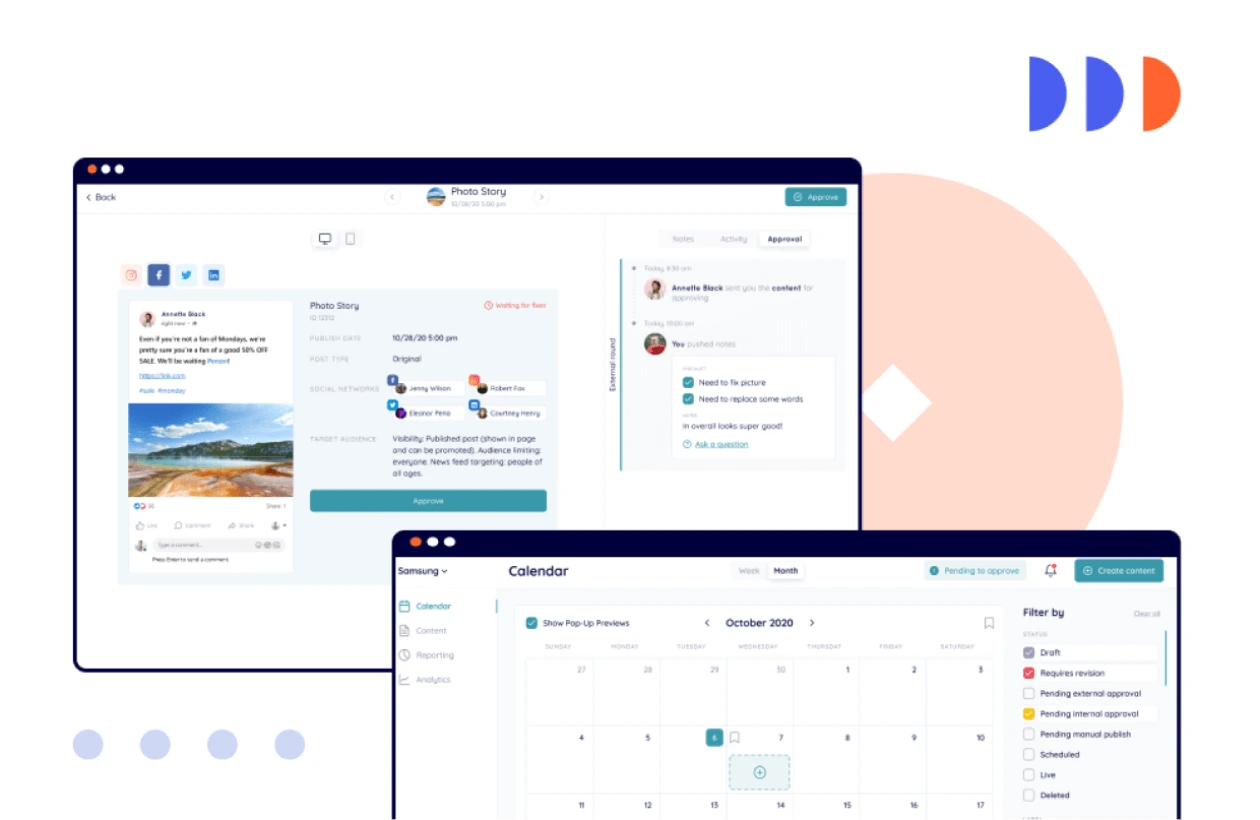
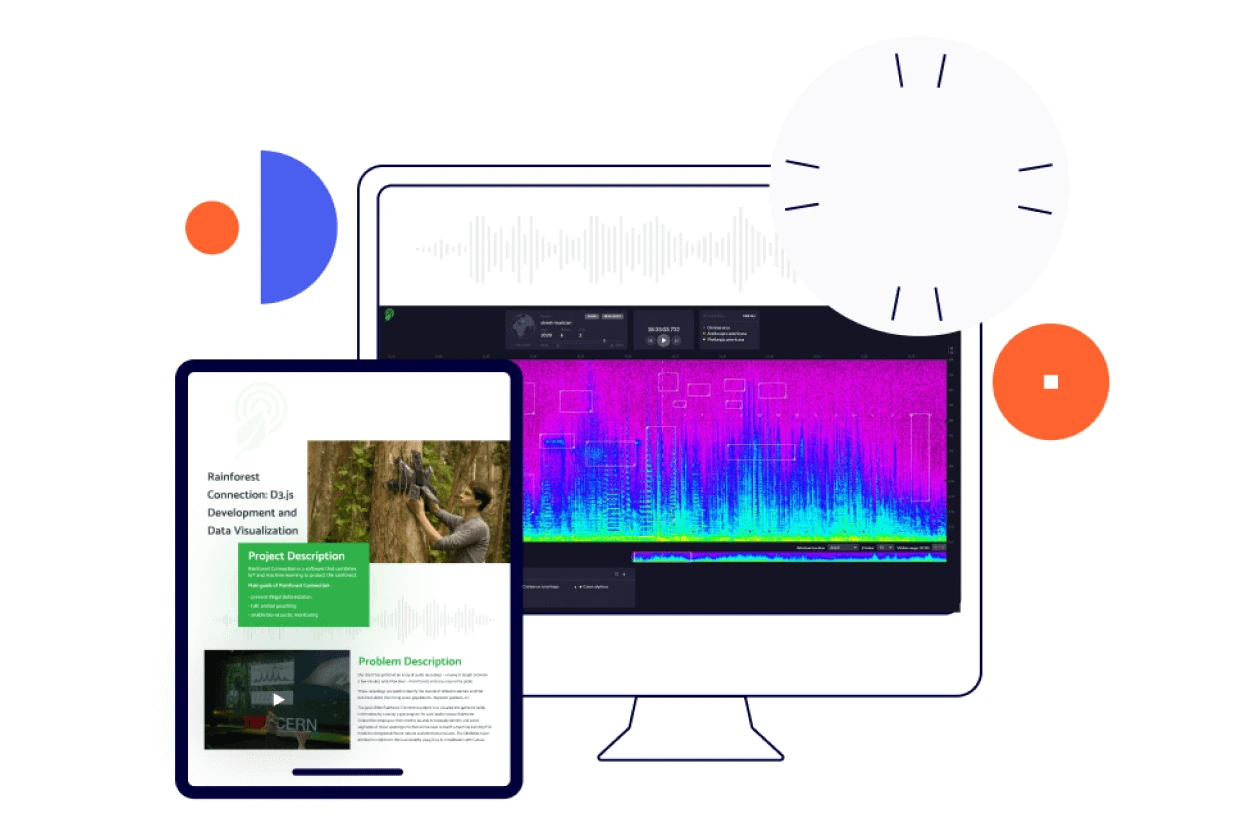
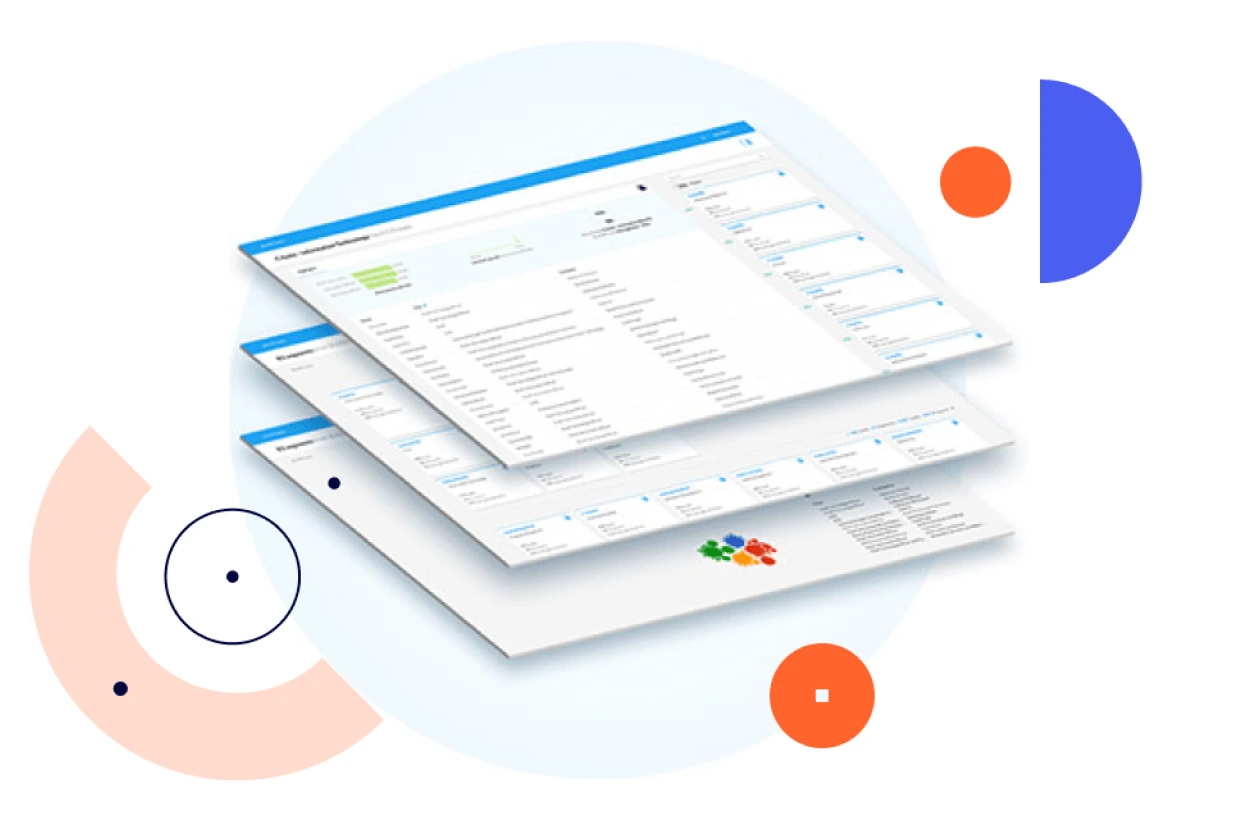
The goal of the Rainforest Connection project is to visualize the gathered audio information by creating a spectrogram for each audio stream. Rainforest Connection employees then need to be able to manually identify and select segments of these spectrograms that will be used to teach a machine learning (ML) model to recognize different natural and mechanical sounds. The Clockwise team decided to implement this functionality using D3.js in combination with Canvas.
This product was to be integrated into the existing Rainforest Connection infrastructure. To ensure seamless integration, our client provided design and component concepts.
Sound samples (animal noises and mechanical sounds) are stored on a server.
To build the new functionality, we followed Agile principles, decomposing the end goal into small tasks and iterating as we went.
Our client was looking for D3 developers to take over the work with spectrograms. Having successful D3.js projects in our portfolio proved our expertise and readiness to join the Rainforest Connection distributed team.
Angular 7for frontend development
D3.jsfor creating interactive spectrograms
Web Audio APIfor processing streams
Canvasfor creating waveform components
We implemented all spectrogram functionality with the help of D3.js and Canvas.
Rainforest Connection is a startup. Naturally, the team has to work in a dynamic environment. The concept of the app, its core features, and the development process are reviewed and updated frequently. Changing requirements and no clear end goal are a challenge for the team. However, our experience working with startups helped us to quickly find the right pace.
The main technical challenge was to sync audio playback and spectrogram zooming.
Canvas is the default frontend tool for various dashboards and graphics. However, it can generate a spectrogram only for an audio section that has already been loaded. Since users should be able to quickly move back and forth in spectrograms, this didn’t seem like the right solution.
So we decided to generate spectrograms on the back end and then send them to the front end. D3 development madeit possible to extend a spectrogram, select the section that exactly corresponds with the audio in the recording, and identify it.
Sound visualization and manual identification of natural and mechanical sounds were used to train the AI to identify chainsaw sounds. In Malaysia, the system helped to catch illegal loggers.
Rainforest Connection has partnered with a scientific institute that researches whales and orcas. An array of audio streams gathered near the Canadian shore helps scientists study animal behavior.
The system is also used to study monkey populations and migration. Visualized data help to detect changes in monkey behavior according to the season, time of day, natural events, etc.
Sound monitoring helps to detect changes in bird and animal behavior before and during earthquakes. This information can be used to predict natural disasters.
Rainforest Connection received investment from Google at the end of 2019. Now, the company is preparing to present the product with the new dashboard developed by Clockwise Software and pitch for the next round of investment.