AI solutions
What we do
Services
Experts in
How we work

Fortune #40 Global Health Leader
1886-founded | 131K employees | $16B in R&D

NYSE: EB
850k creators | 300M tickets sold in 2023

8th GPS App in the US
3M+ in 2023 | 10M+ Google Play downloads

Cultural Exchange Led by 2K+ Team
Est. 1980 | 500K+ Alumni | 100+ Countries

$12M Revenue Tech Co.
MBE Certified by NMSDC

Trusted Logistics Co. Since 1979
ISO9001 Certified Systems Integrator

3rd in Retail Inc. 5000
$6M+ raised | #1 ranked company in CT

UCSF-Trusted Health App
with 50K+ users in 60+ countries

Google-Funded Green Tech
144K Ha Monitored | Featured by Reuters

Telecom Experts Est. 2005
Google, Proximus & Orange partners

NASA-Trusted Workflows Builder
Est. in 2007 | PCI, GDPR & HIPAA certified

Top Swiss Agency
Awarded #1 Swiss App in 2025

#2 SMM Agency in Australia
Serves 1k+ Australian B2B across 20+ domains

Google Cloud Partner
Trusted by Fortune 5 UHG

F&B Startup with 25K+ Guests/Y
4.5 on TripAdvisor | 600+ Dining Partners
Fortune #40 Global Health Leader
1886-founded | 131K employees | $16B in R&D
NYSE: EB
850k creators | 300M tickets sold in 2023
8th GPS App in the US
3M+ in 2023 | 10M+ Google Play downloads
Cultural Exchange Led by 2K+ Team
Est. 1980 | 500K+ Alumni | 100+ Countries
$12M Revenue Tech Co.
MBE Certified by NMSDC
Trusted Logistics Co. Since 1979
ISO9001 Certified Systems Integrator
F&B Startup with 25K+ Guests/Y
4.5 on TripAdvisor | 600+ Dining Partners
Google Cloud Partner
Trusted by Fortune 5 UHG
#2 SMM Agency in Australia
Serves 1k+ Australian B2B across 20+ domains
Top Swiss Agency
Awarded #1 Swiss App in 2025
NASA-Trusted Workflows Builder
Est. in 2007 | PCI, GDPR & HIPAA certified
Telecom Experts Est. 2005
Google, Proximus & Orange partners
Google-Funded Green Tech
144K Ha Monitored | Featured by Reuters
UCSF-Trusted Health App
with 50K+ users in 60+ countries
3rd in Retail Inc. 5000
$6M+ raised | #1 ranked company in CT
Trusted Logistics Co. Since 1979
ISO9001 Certified Systems Integrator
$12M Revenue Tech Co.
MBE Certified by NMSDC
Cultural Exchange Led by 2K+ Team
Est. 1980 | 500K+ Alumni | 100+ Countries
8th GPS App in the US
3M+ in 2023 | 10M+ Google Play downloads
NYSE: EB
850k creators | 300M tickets sold in 2023
Fortune #40 Global Health Leader
1886-founded | 131K employees | $16B in R&D
F&B Startup with 25K+ Guests/Y
4.5 on TripAdvisor | 600+ Dining Partners
Google Cloud Partner
Trusted by Fortune 5 UHG
#2 SMM Agency in Australia
Serves 1k+ Australian B2B across 20+ domains
Top Swiss Agency
Awarded #1 Swiss App in 2025
NASA-Trusted Workflows Builder
Est. in 2007 | PCI, GDPR & HIPAA certified
Telecom Experts Est. 2005
Google, Proximus & Orange partners
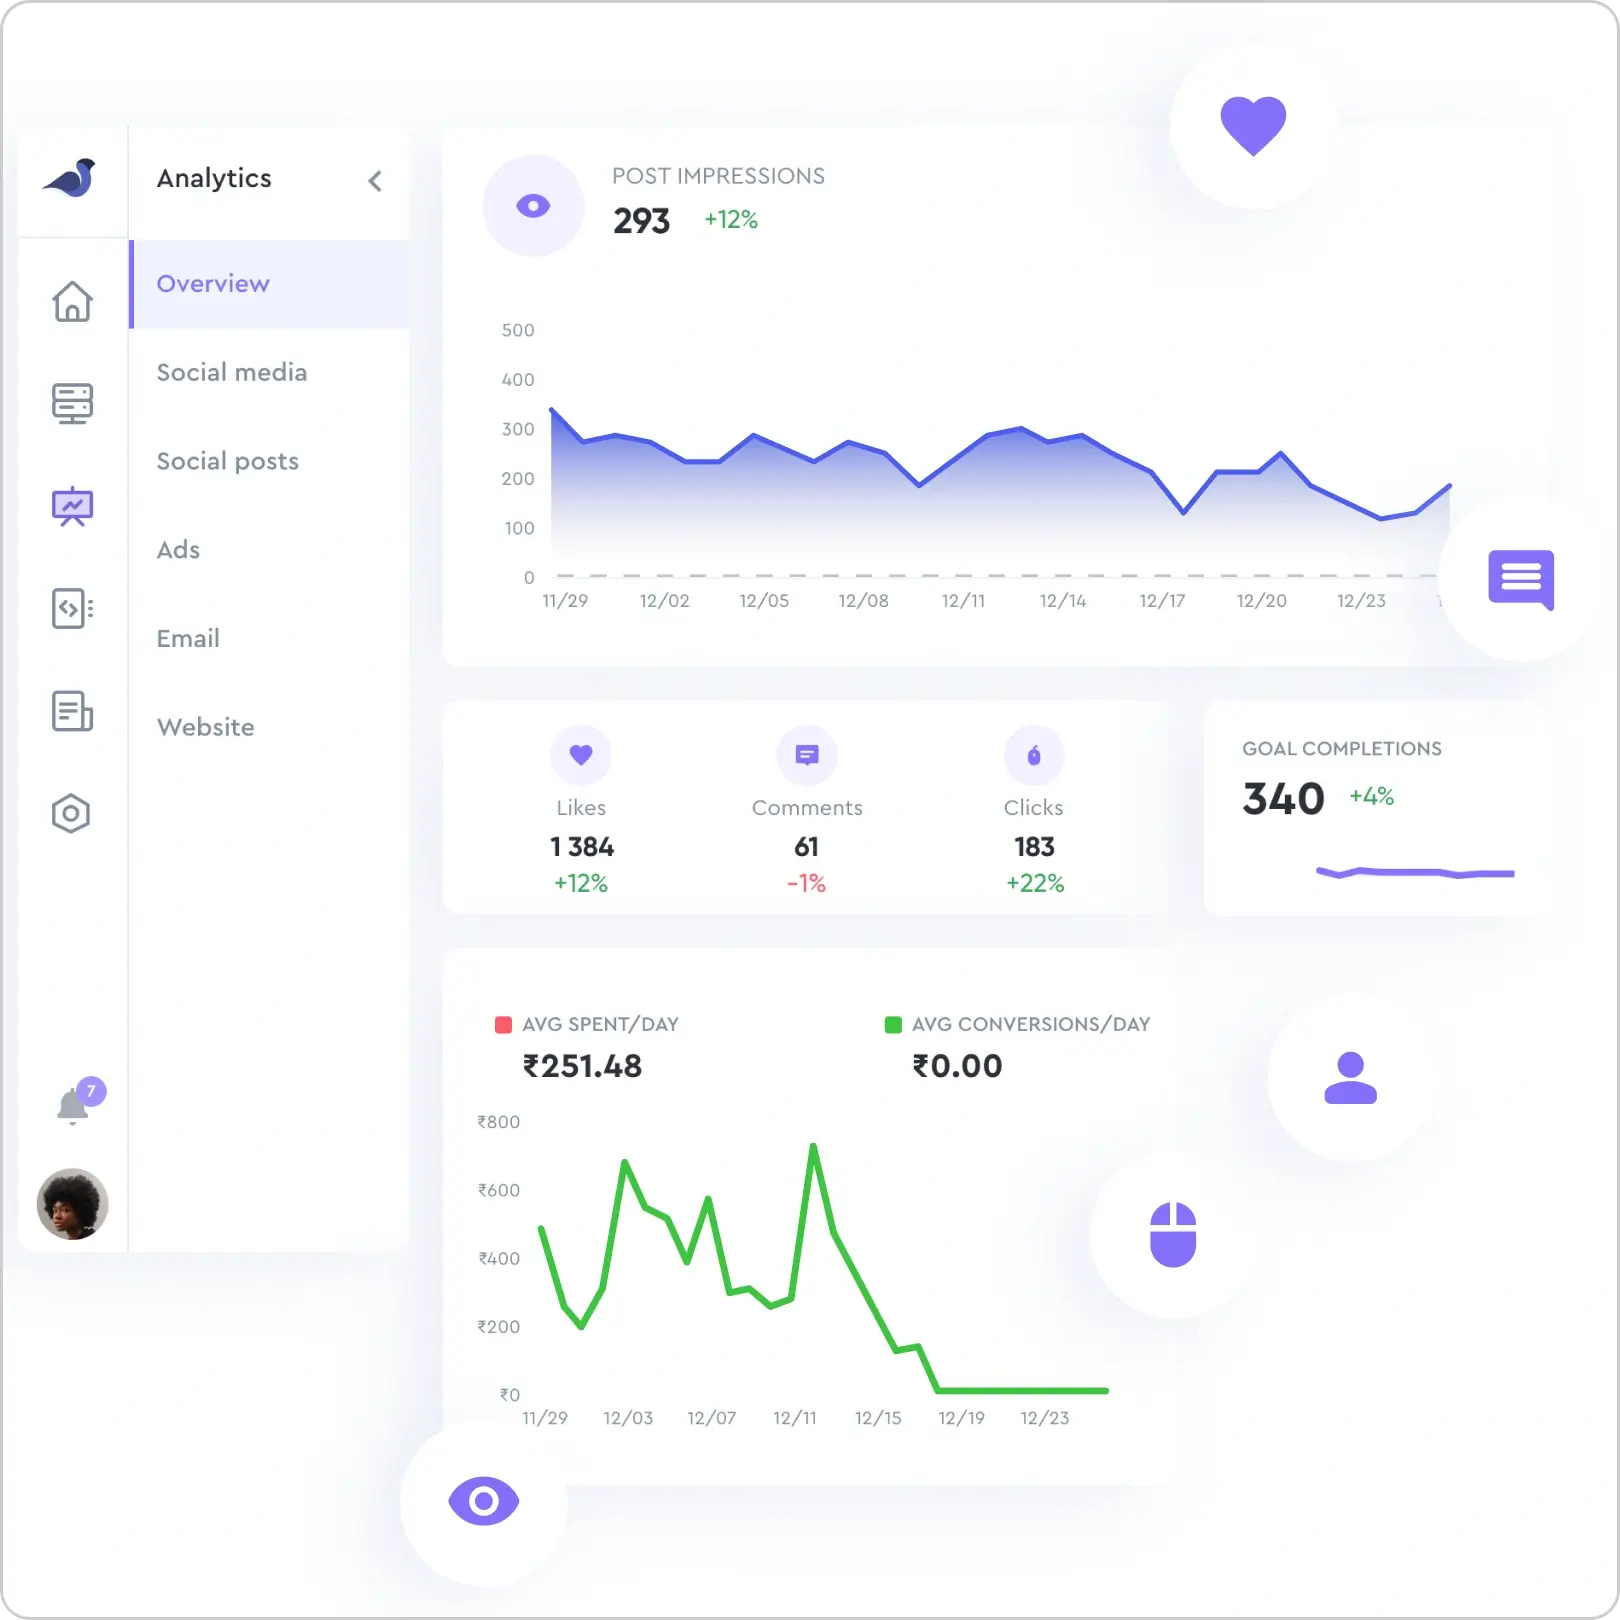
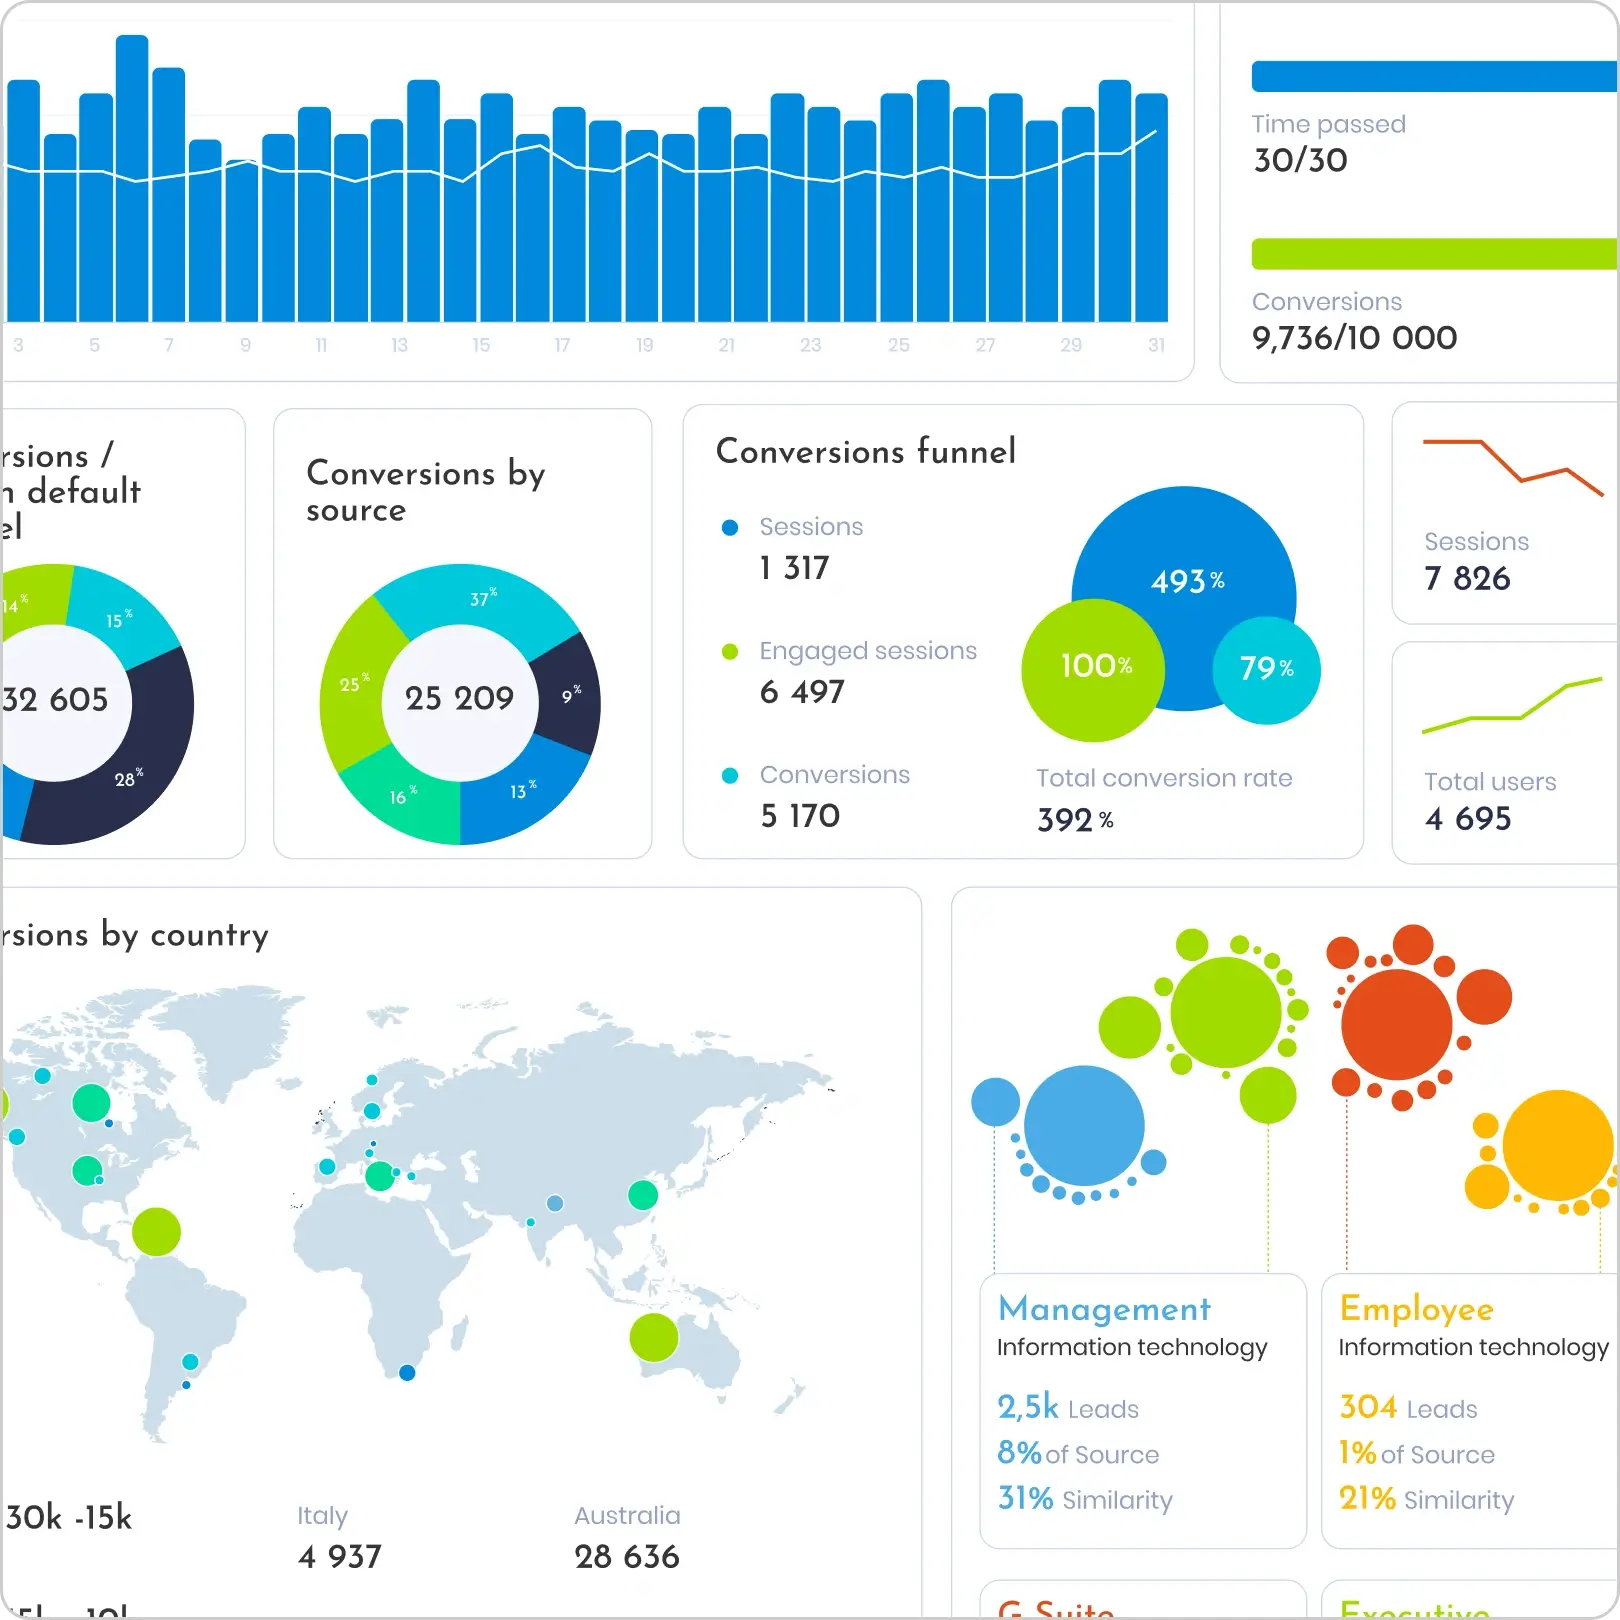
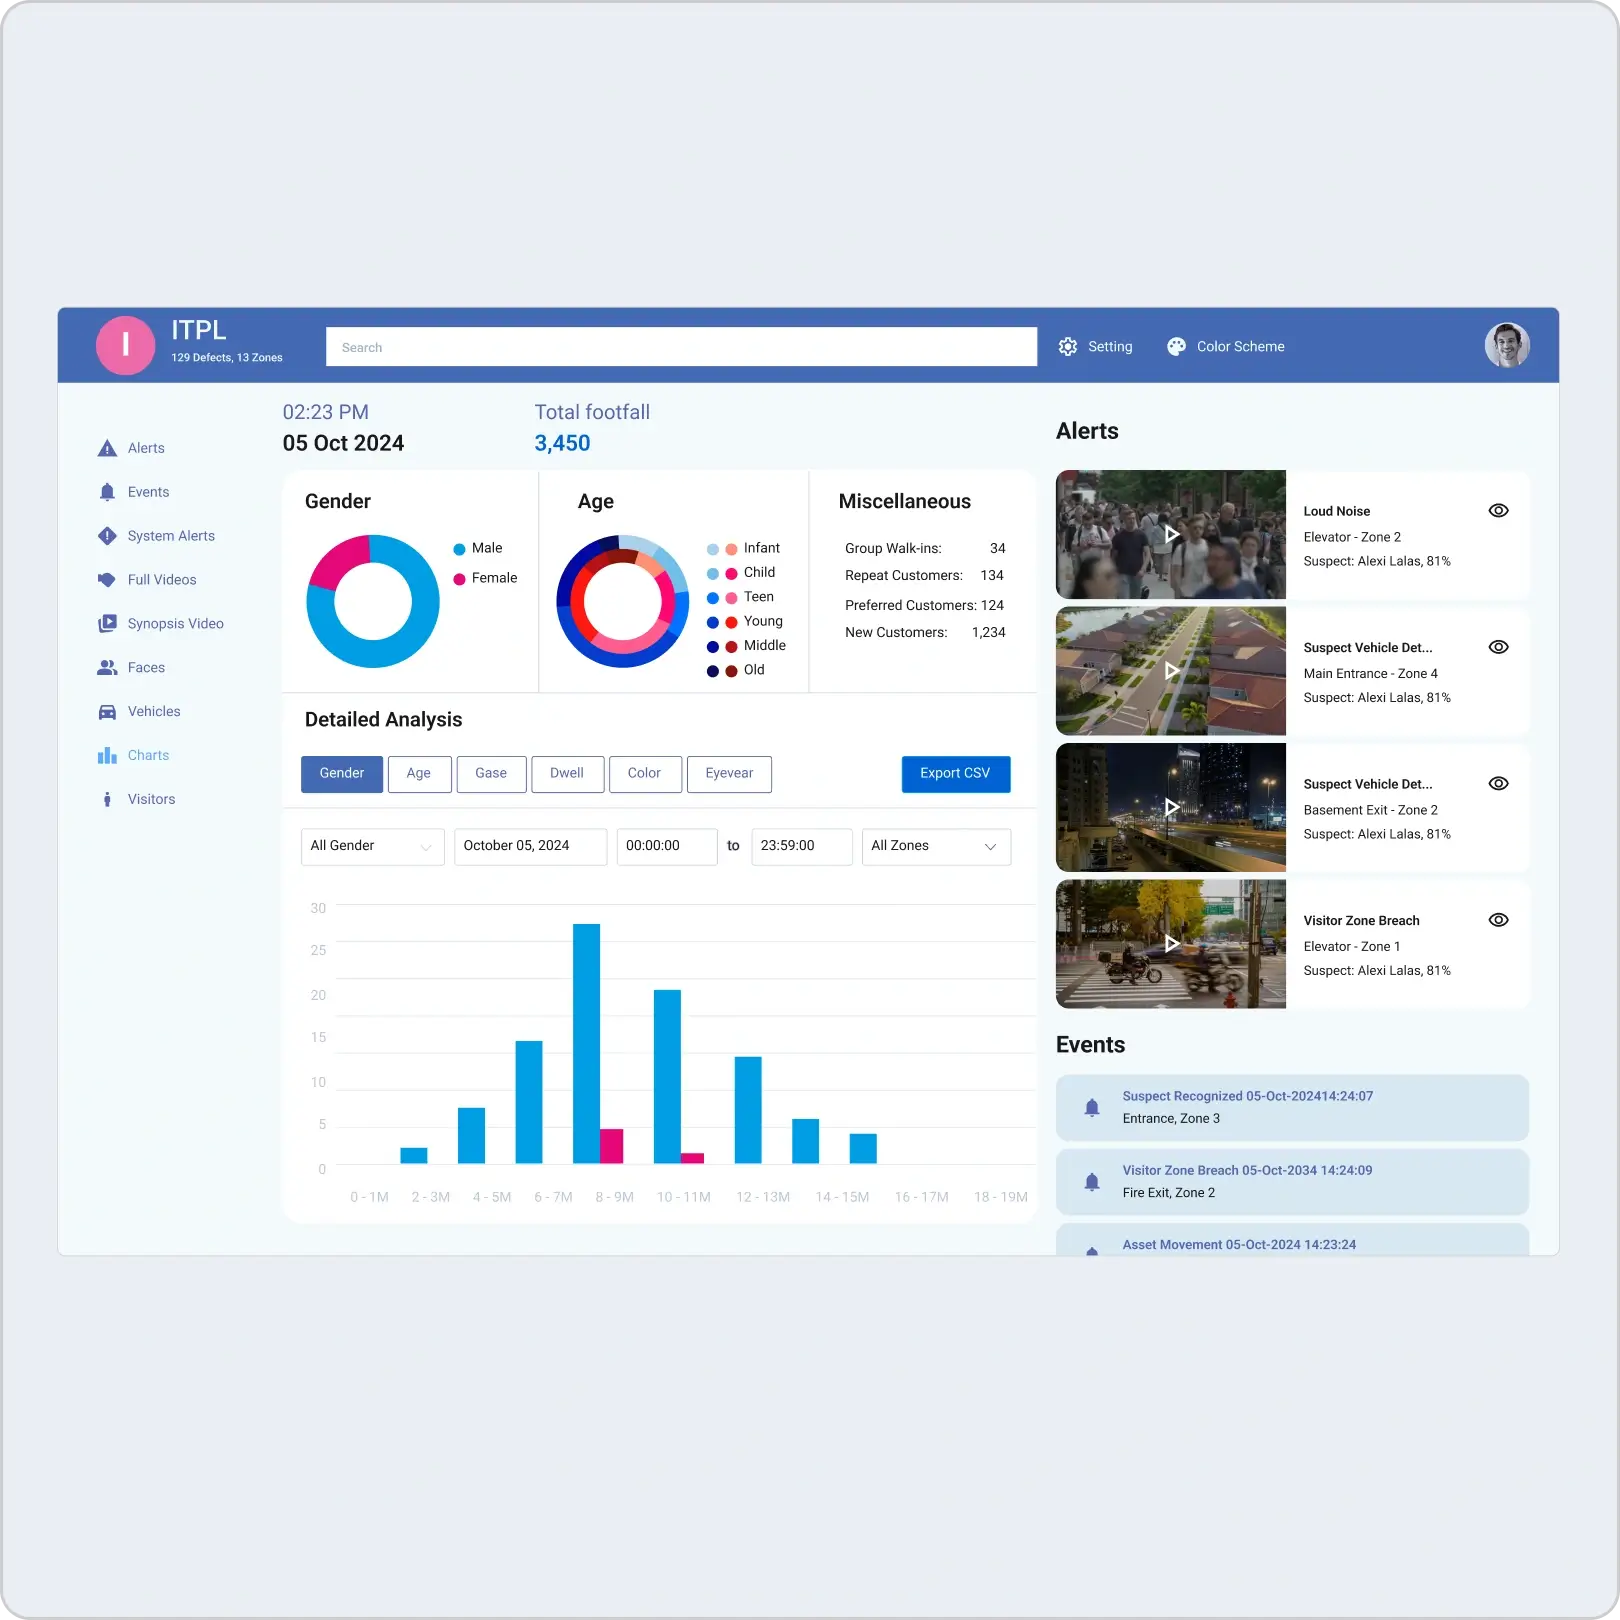
Connect all your data sources into one flow, eliminating silos and giving you a clear view of your business performance.
Get real-time insights that drive quick decisions, team alignment, and better business performance.
Spot trends early, forecast outcomes, and make smarter decisions to keep your business one step ahead.
Turn complex data into meaningful stories that highlight trends, reveal insights, and guide more confident decisions.
Get accurate, automated reports tailored to your goals. No manual work — just the exact data you need, delivered on time.
Keep your data safe with robust security protocols, ensuring secure access, full compliance, and peace of mind.
Easily handle growing data volumes and evolving business needs with a tool designed to scale seamlessly as you grow.
Access your data on the go with mobile-friendly interfaces that deliver insights anytime, anywhere, on any device.


The first step is understanding your business and its unique relationship with data. We ask key questions like what types of data do you collect? What are your main data sources? What insights are you aiming to uncover? Who will use the solution, and what decisions will it support? By analyzing your goals, workflows, and challenges, we define the scope, map key features, and identify necessary integrations. This process ensures we build a solution tailored to your needs while setting the foundation for a seamless and efficient development journey.
Learn about our discovery
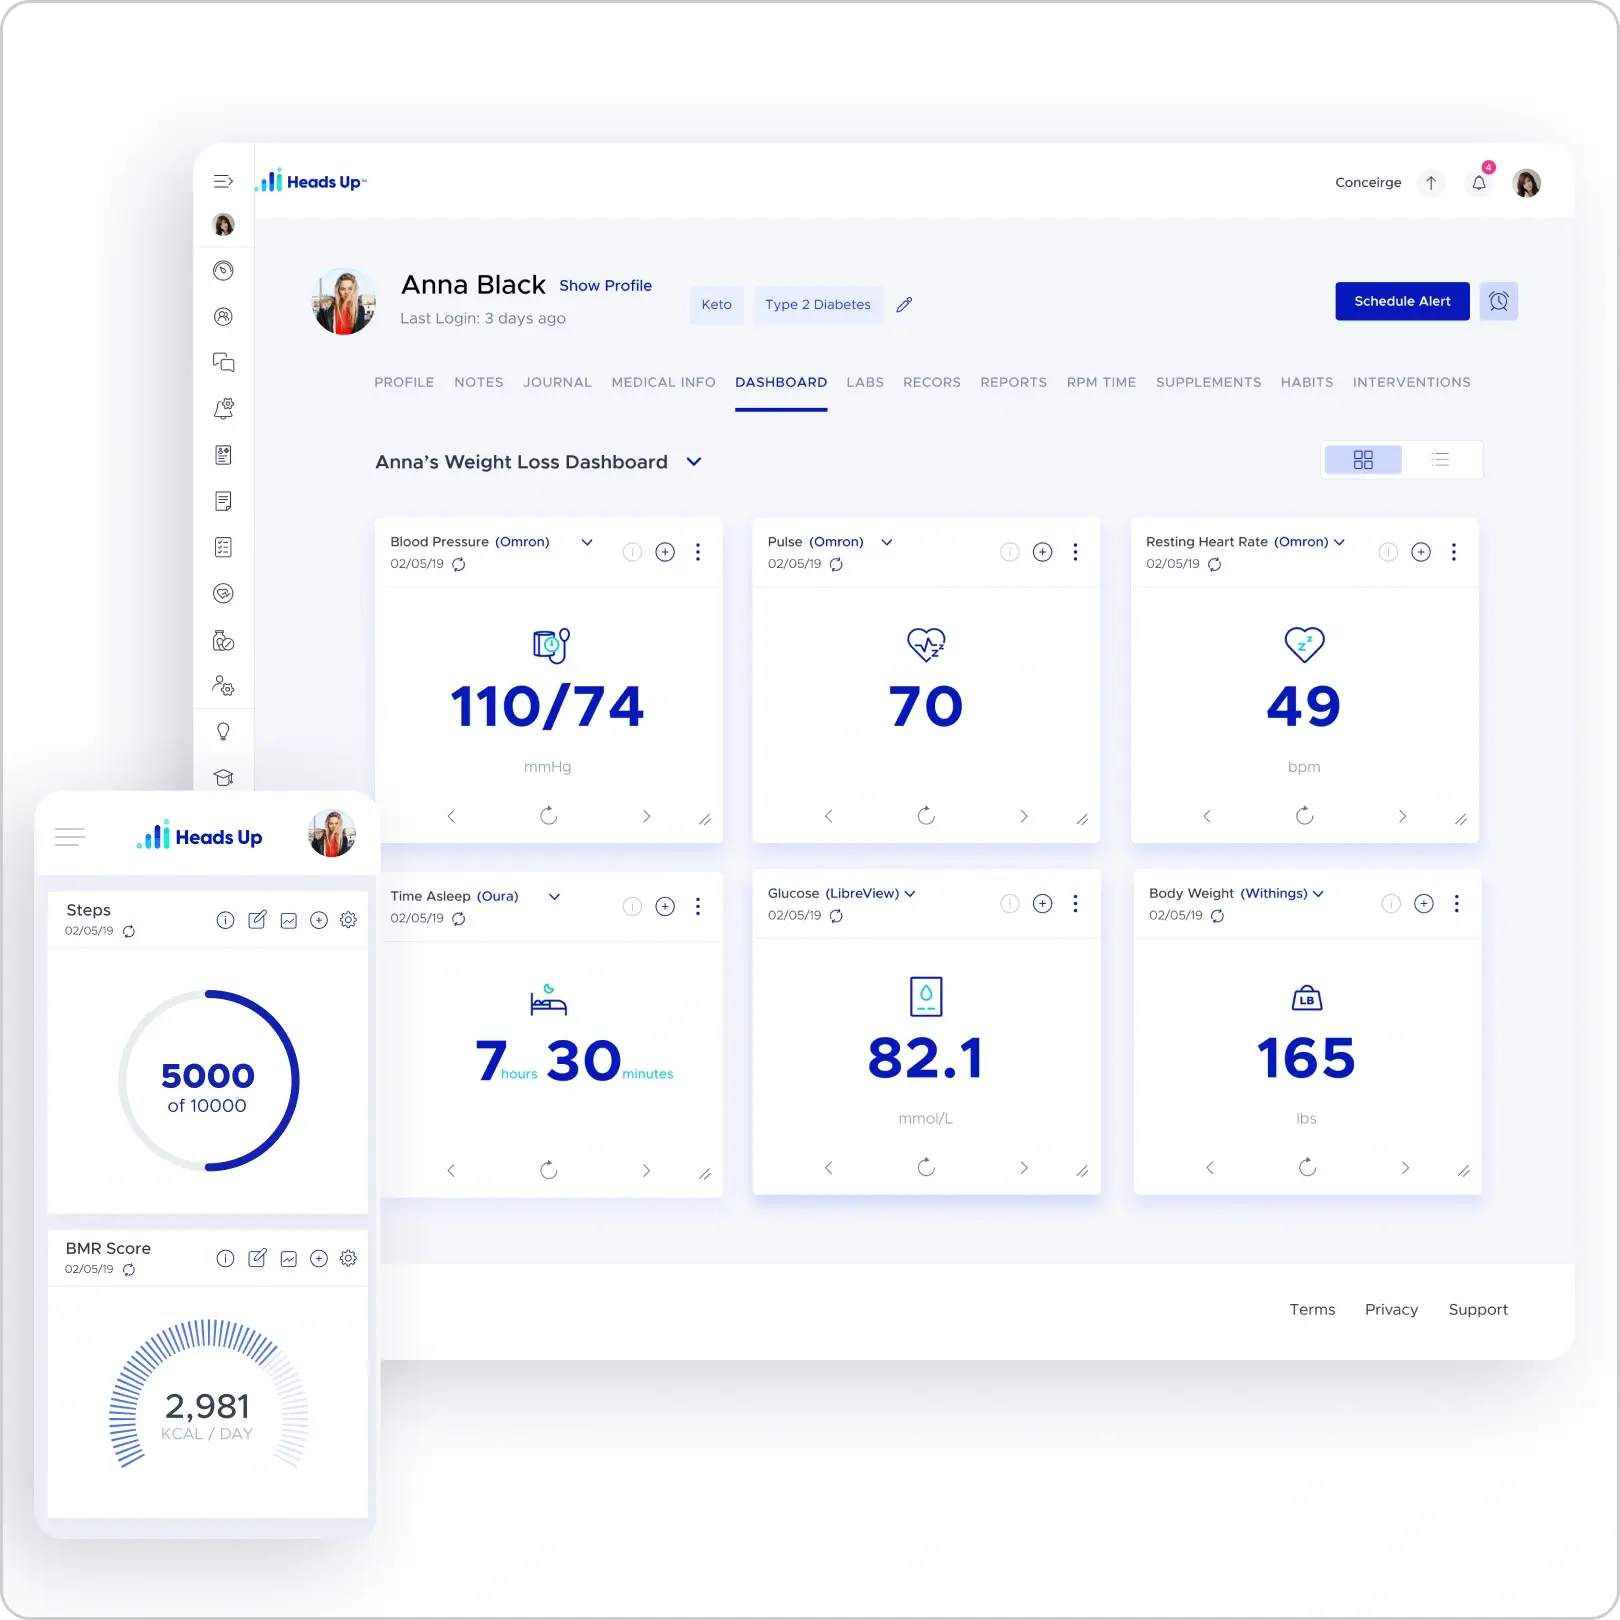
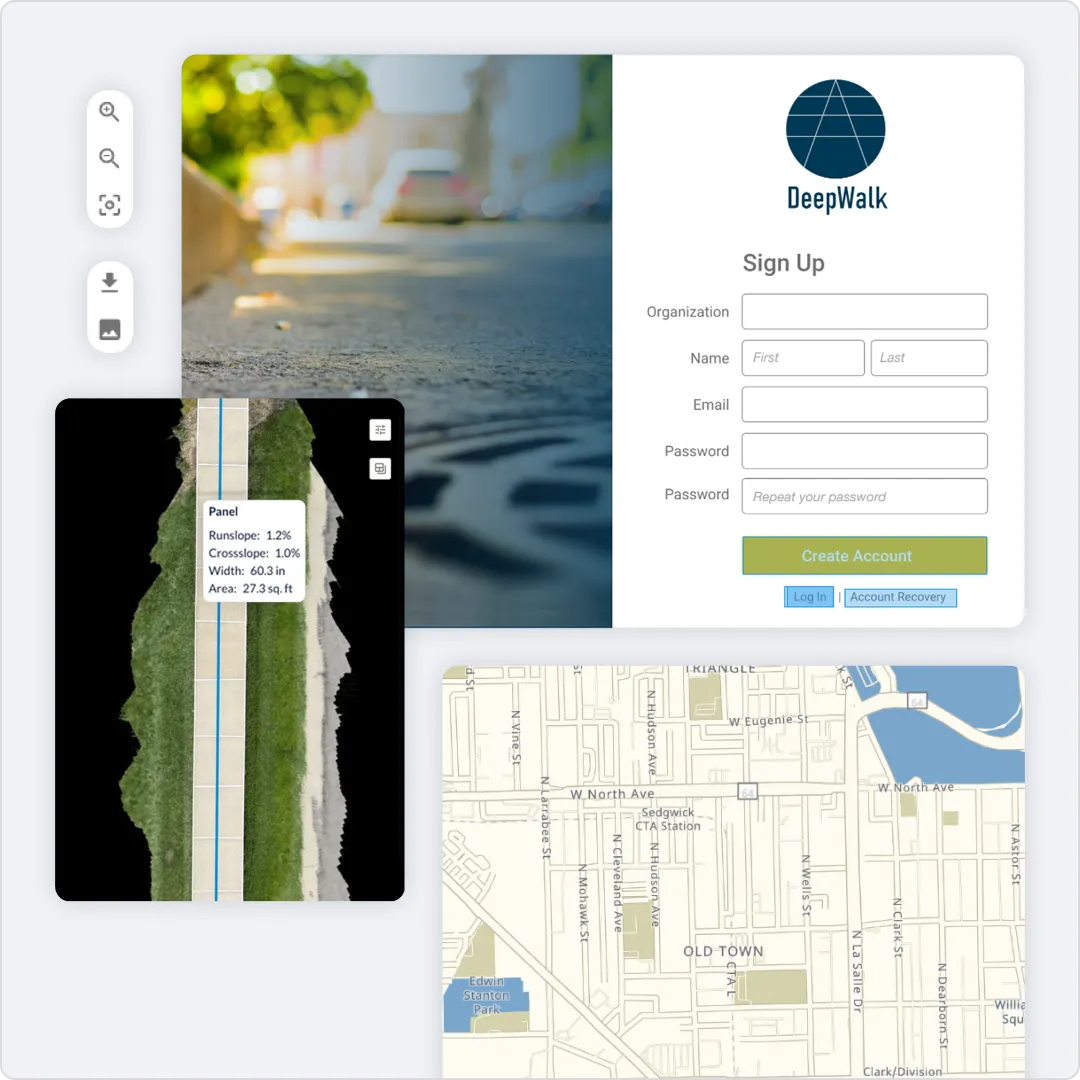
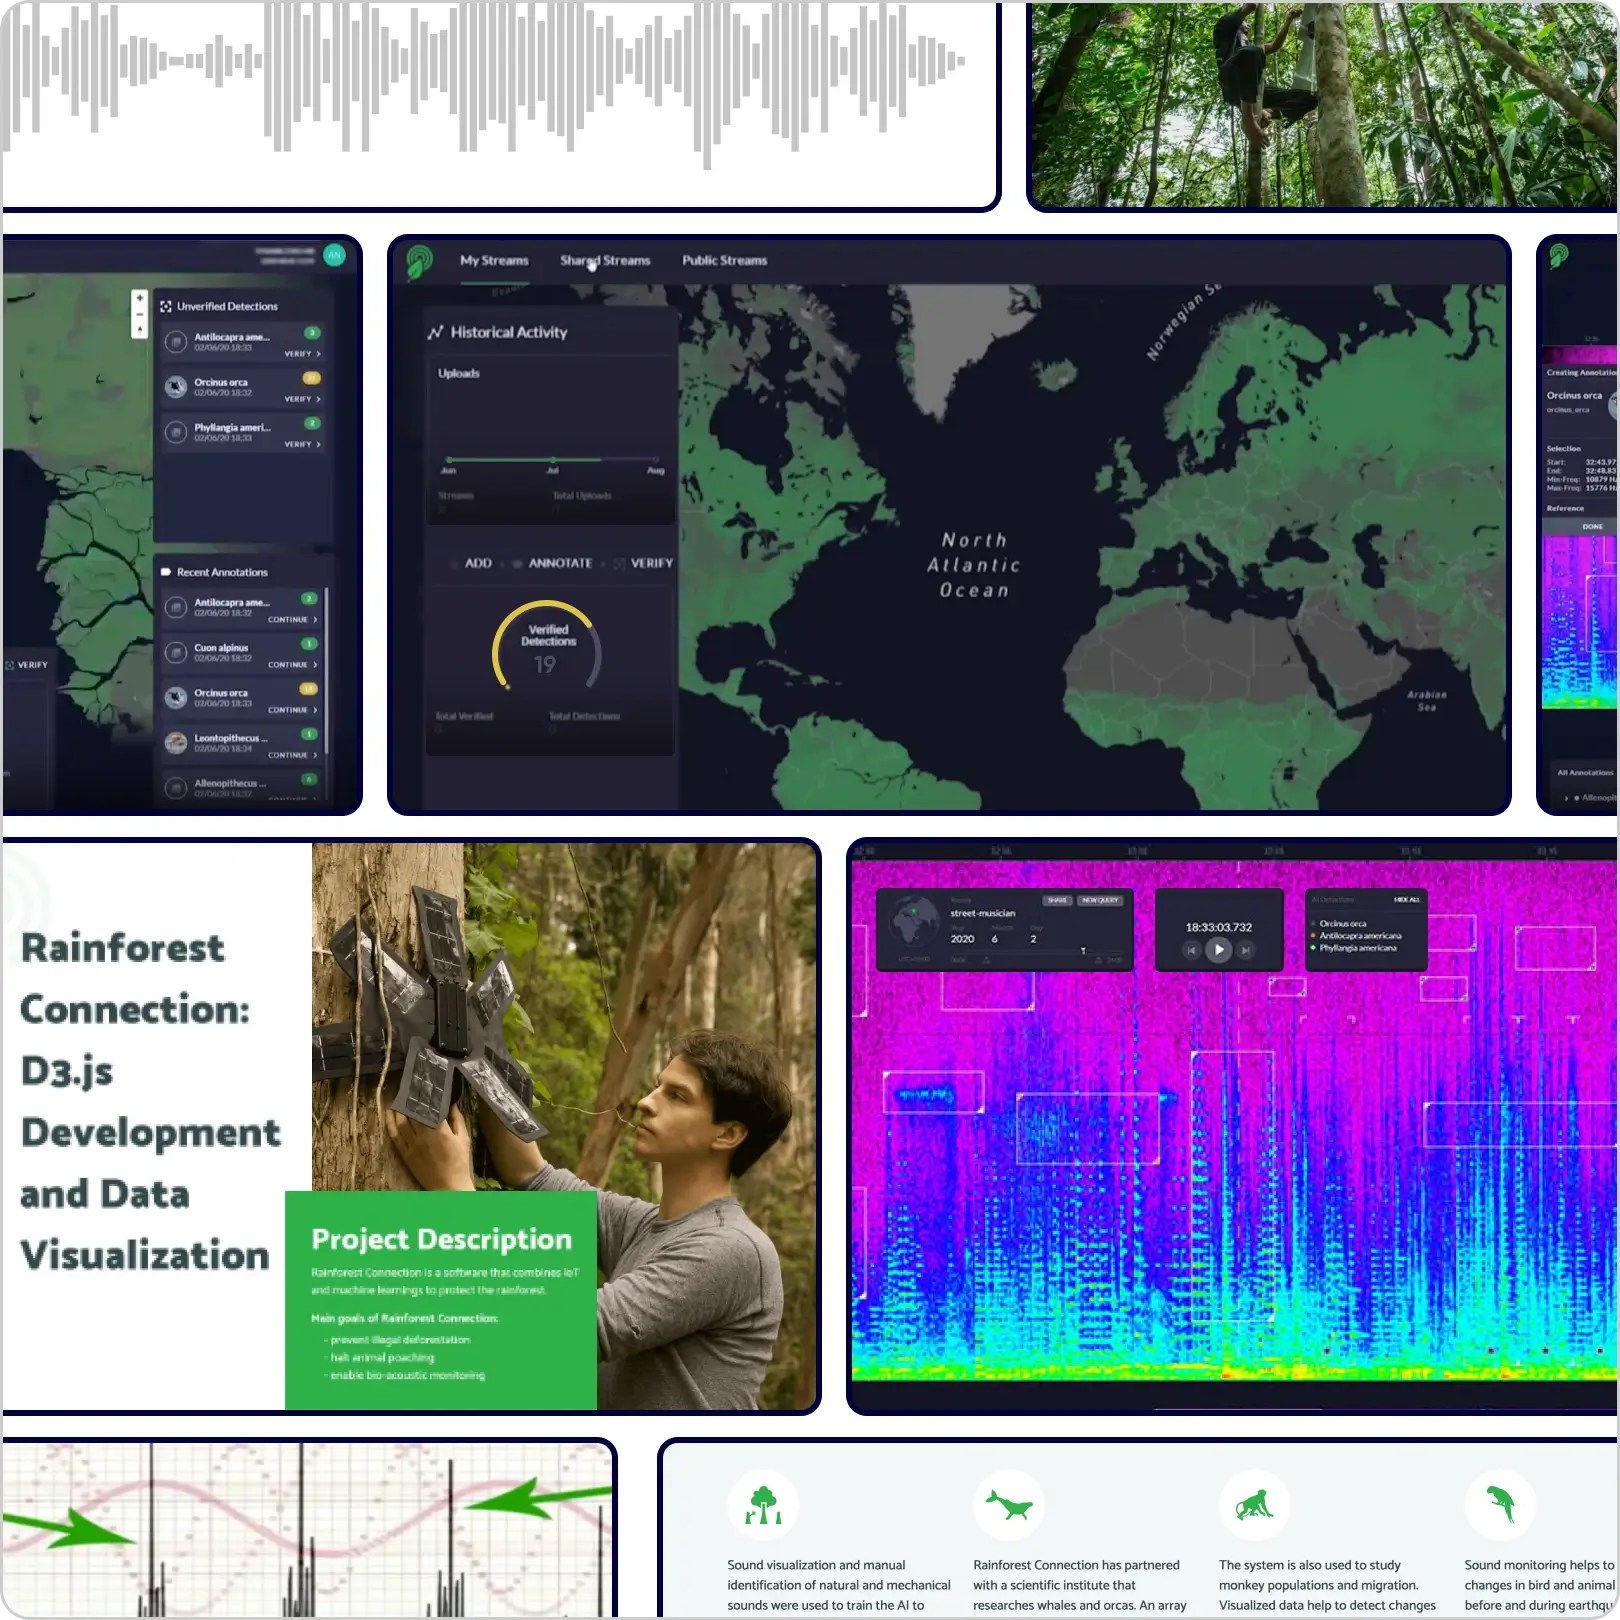
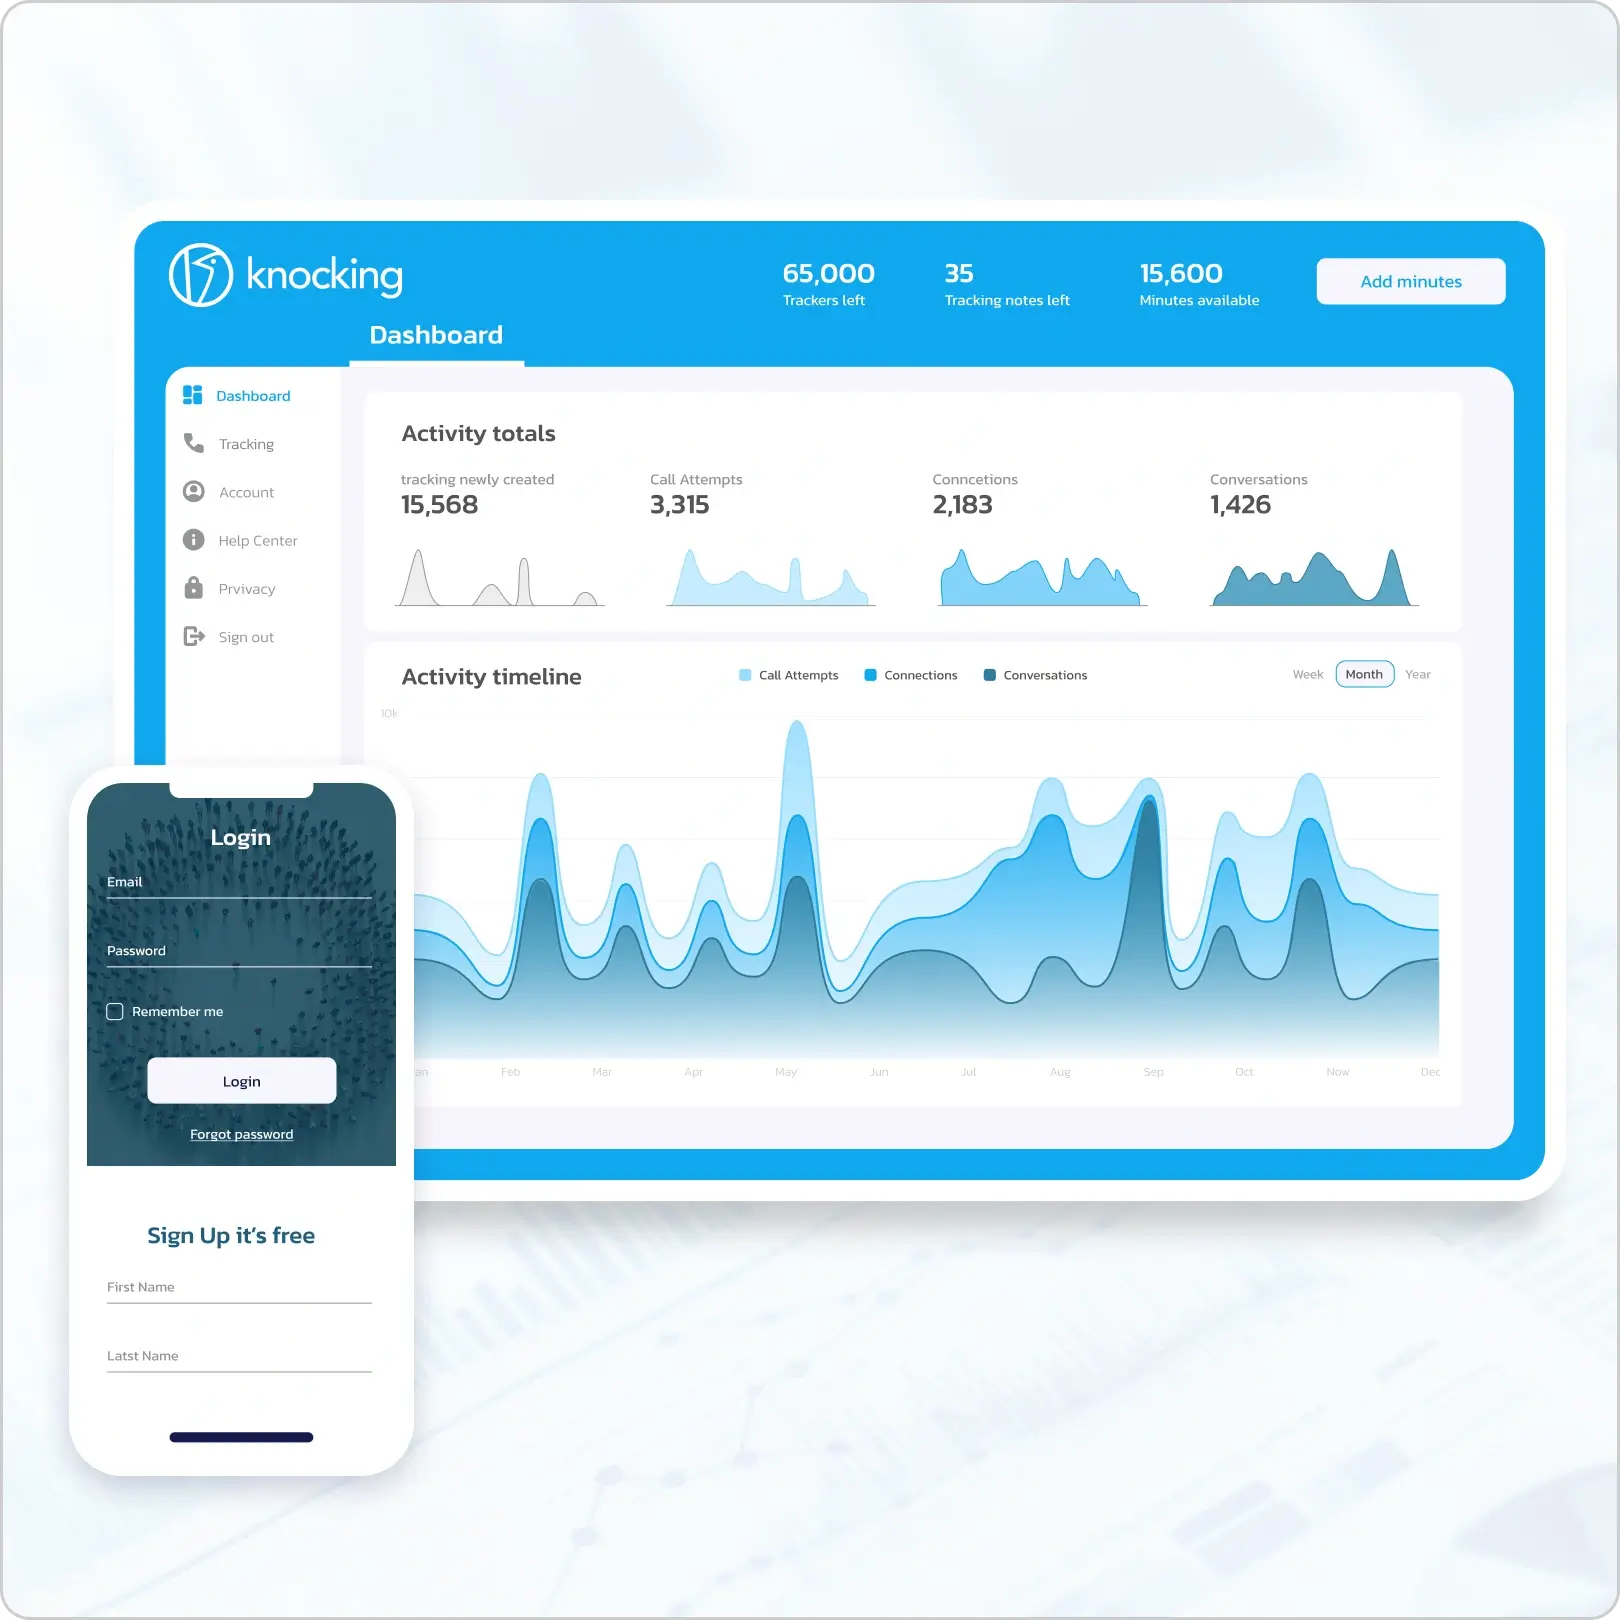
We design interfaces that look great and make complex data simple to act on. Our designers focus on crafting dashboards and visualizations that prioritize usability and ensure users can access insights effortlessly. From choosing the right charts and graphs to structuring data layouts for maximum clarity, every design decision enhances the value of your dashboards. Wireframes, prototypes, and user flows are carefully aligned with your workflows and goals, ensuring the final product not only looks good but works seamlessly in real-world scenarios.
We bring your solution to life using secure, scalable code and a custom toolset tailored to your needs. At the core of our development process is D3.js, a powerful tool for creating interactive and dynamic visualizations. From custom graphs and heatmaps to complex hierarchical data displays, D3 offers endless possibilities. And we’re the team that knows how to employ its full potential for your project. We combine D3 with other supportive tools to craft an optimized, project-specific toolset. This ensures that every feature (real-time updates, seamless integrations, or customizable dashboards) matches your exact business needs. With <10% CPI & SPI variance and 200+ projects under our belt, we provide predictable results.
Before launch, we put your solution through rigorous testing to validate data accuracy, performance, and security. Simulating real-world scenarios, we ensure dashboards, data analytics, and integrations work flawlessly. Our QA process, reflected in a 99.89% acceptance rate, guarantees a reliable product ready for real use.
When it’s time to go live, we ensure a smooth and disruption-free launch. Whether on-premise or in the cloud, our deployment process is meticulously managed to avoid downtime. We monitor performance closely, resolving any last-minute issues to make sure your solution is operational and ready from day one.
The launch is just the beginning. We stick around to ensure your data visualization tools evolve with your business. Whether it’s scaling to handle more data or more users, fine-tuning features, or adding new capabilities, we’re here to help you grow. Our long-term partnerships and proactive support mean your solution stays ahead of the curve.
Solution architect

We’ve built 10+ data visualization platforms with diverse data types. Your platform will get the right tech to keep insights clear and dependable.
We stick to realistic schedules, managing scope with precision and tracking the Schedule Performance Index (SPI) to ensure progress stays on track. If adjustments are needed, we promptly communicate their impact on timelines. With <10% SPI variance across our projects, we deliver data visualization solutions reliably and on time.

Our budget management combines transparency with accuracy. By tracking the Cost Performance Index (CPI) and keeping it low, we ensure spending aligns with your plan. Weekly updates show estimates vs. actuals, while approval-first invoicing keeps costs predictable. This way, you know where your money goes, with no surprises in the end.

You’ll always know what’s happening with full access to our progress. From detailed reports and milestone tracking to kanban boards and code repositories, transparency of data visualization services is built into our workflow. This keeps you informed and in control every step of the way.

We don’t wait for problems to escalate. Potential risks are tracked in a dedicated register, complete with mitigation plans and regular updates. By addressing issues early, we ensure your project stays on course, avoiding costly surprises down the road.

11+
data platforms
<10%
CPI & SPI variance
99.89%
acceptance rate
3.8
years avg. tenure
5.5%
churn rate (2023)
2014
founded in
Your data platform will be designed to handle large datasets without slowing down. We work with libraries like D3.js and implement performance-focused techniques like optimized architecture, efficient queries, and caching to keep charts and dashboards fast and interactive. For massive datasets, we also use streaming or batch processing so the visuals stay responsive as your data scales.
Yes, the platform can integrate with your existing data sources and tools. During the discovery stage, we’ll go through documentation of all the connections you need (for example, databases, CRMs, APIs, or BI tools). We’ll check if their limitations and corner cases won’t get in the way of implementing everything you need, and then define the integration approach.
We make dashboards and reports customizable. Need filters and layout variations, so users can adjust visuals to their needs? No problem. Want to create role-specific views for different team members? We can implement it. Our data analytics and visualization services are fully tailored to your needs. During discovery, we’ll define which parts should be flexible for end users and which should stay fixed.
Absolutely. We can configure your platform to stream data straight into dashboards so numbers refresh on the spot. Or make your platform support near-real-time updates with custom update intervals. We’ll go over your use case together and pick the setup that makes the most sense.
If you need mobile accessibility, we will design the mobile version of your platform. All dashboards and reports will be responsive to adapt to mobile screen views without losing clarity. If you need a dedicated mobile app, we can build one too — we’ll discuss all your requirements at the start and plan development with them in mind.
We discuss quality requirements with you at the start and take them into account when creating a testing strategy for your product. Throughout development, we run regular demos, so you can see the built parts as soon as they’re ready and give feedback if you want us to change something. This approach stays behind our 99.89% work acceptance rate.
You’ll have access to everything: design files, documentation, code repositories, and project boards. Our digital data visualization services include regular demos and sprint reviews so you can see progress in action, share feedback, and adjust priorities if needed. On top of that, we set up clear communication channels and regular calls, so you’re always informed of the progress, and key decisions are made together.
You’ll have full access to the code, documentation, and all deliverables, written and organized so your team can understand it easily. If you want to take over, we run structured knowledge transfer sessions with walkthroughs and Q&A, making sure your team has the expertise and control to manage the platform without relying on data visualization services companies.
Great preparation and full transparency are what help us maintain a 99.89% work acceptance rate.
We document and confirm all system requirements and development plans with you upfront. During development, you get regular demos, progress reports, and access to code and documentation, so you can see the work as it happens. And if adjustments are needed, our Agile approach allows us to course-correct development without harm to budget or timelines.
Most of our engineers stays on projects for 3.3 years on average, which means most of them see the product through its key stages and build deep knowledge of the product and code. If a team member does leave, we have processes and documentation in place to onboard a new specialist without disrupting project timelines.
Yes, your team will be able to maintain the code without being dependent on us. We create comprehensive project documentation and can run knowledge transfer sessions with your team, so they understand the architecture, integrations, and workflows. That way, you stay in full control and can continue development in-house.
A language barrier won’t be an issue. Our team is fluent in English and has years of experience working with international clients, 98% of whom are based in the UK and US. We make communication smooth and predictable by creating a tailored communication plan with defined update intervals, channels, and roles.
Yes, you retain 100% ownership of the product’s intellectual property. All code, designs, and project materials developed during the engagement are transferred to you. We include clear terms in our contracts to protect your IP.
Yes. Since the conflict began, our operations have continued without interruption. We’ve signed new long-term clients, maintained a stable headcount, and consistently delivered high-quality work. Our fully cloud-based infrastructure and distributed team across secure locations in Ukraine and abroad ensure business continuity and reliable delivery, even in challenging times.
Estimates for your project will be grounded in your requirements and our experience delivering similar functionality. Once development starts, we track timelines and budget closely, comparing actuals against estimates and keeping you updated with regular reports. This approach has helped us maintain less than 10% variance on CPI and SPI across 200+ projects, so you can count on realistic estimates and a budget that stays on track.
$15,000 to $50,000
Refine your idea and validate it with a small-scale prototype
$50,000 to $100,000
Implement data visualization in your existing application
$100,000 to $500,000
Custom software for your needs with data visualization functionality
$500,000+
Data visualization software development to cover the needs of large businesses