
Any questions unanswered?
Let's discuss them


As a logistics software development company that has delivered logistics apps for 10+ years, we have had the opportunity to work on a wide variety of projects. We’ve made analytics dashboards for
That’s why we can say confidently: we know the business value of logistics analytics dashboards, how to implement them, and how exactly your business can benefit from them.
After reading this article, you will find out everything you need about how to approach logistics dashboard development the right way to get measurable results and improve operational metrics.
Running a logistics business means managing a tightly connected system. Orders, routes, vehicles, warehouses, drivers, fuel, and delivery commitments influence each other every day. A delay in one area cascades across cost, capacity, and service quality.
Most logistics companies track dozens of operational metrics across multiple systems. Spreadsheets and static reports can show individual numbers, but they don’t show relationships. High-quality analytics dashboards solve this problem by turning fragmented data into a single operational view. They make cause-and-effect visible and allow you to act while there is still room to adjust.
With a well-designed logistics analytics dashboard, you can:
In practice, analytics dashboards give you the visibility needed to manage complexity without slowing the business down.
If you have worked with analytics in other industries, logistics can feel familiar at first. There are dashboards, KPIs, charts, and reports. But once you look closer, the differences become obvious.
Logistics analytics sits directly on top of physical operations, drawing data from vehicles on the road, warehouses in motion, third-party providers, and external conditions that change constantly. Because of this, a logistics analytics dashboard has to support decisions that are both time-sensitive and operationally constrained.
Below is a list of features that explain what a high-quality dashboard must include.
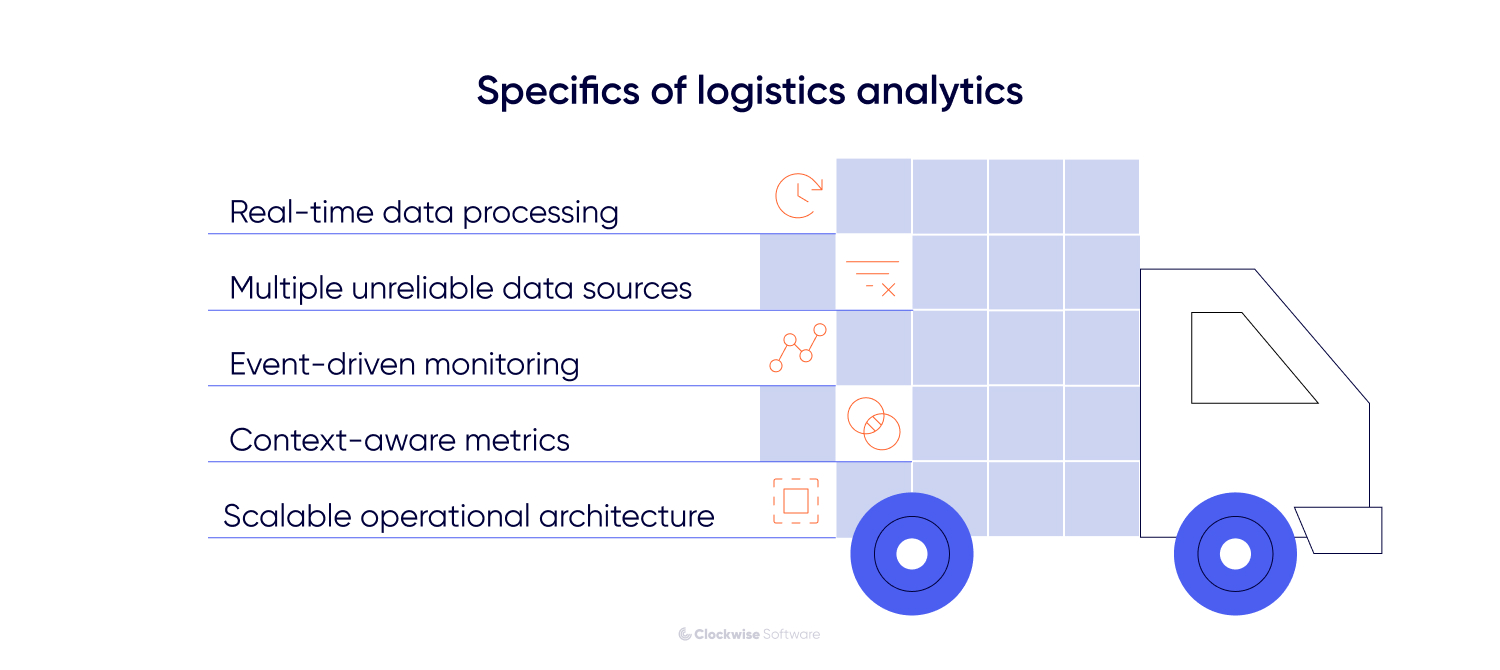
In logistics, many decisions lose value if they arrive too late. Route changes, delivery delays, warehouse congestion, or vehicle availability need to be visible while they can still be corrected.
A logistics analytics dashboard must support continuous data updates and reflect the current operational state. This affects how data pipelines are built, how often dashboards refresh, and how confidently you can rely on what you see when making decisions during the day.
Logistics data is pulled from TMS, WMS, ERP, GPS trackers, telematics systems, accounting tools, and external partners. Some sources update every second, while others update once every few hours or provide only partial data.
In addition, data quality depends not only on the source itself but also on the reliability of system integrations. Unstable APIs, delayed synchronization, or incomplete data transfers can further reduce accuracy and timeliness.
A high-quality dashboard must normalize, reconcile, validate, and continuously monitor both data streams and integrations before visualizing the information. Otherwise, analytics becomes misleading.
Logistics operations are driven by events. A missed pickup, a vehicle breakdown, a route deviation, or a spike in warehouse backlog all require immediate attention.
A truly effective logistics analytics dashboard must be designed around event visibility: highlighting anomalies, changes, and exceptions rather than only displaying aggregated averages.
In logistics, the same number can mean different things depending on context. A 5-minute delay may be irrelevant in one route and critical in another. High vehicle utilization may signal efficiency or risk, depending on maintenance schedules and buffer capacity.
High-quality dashboards account for this by combining metrics with operational context. Time windows, geography, capacity limits, and dependencies must be visible together so that numbers can be interpreted correctly.
As logistics operations grow, analytics must scale with them. More routes, more vehicles, more warehouses, and more integrations increase data volume and complexity.
To support expansion, the analytics platform must evolve accordingly. A logistics analytics dashboard must support this growth without becoming slower or harder to interpret. This requires thoughtful data modeling, flexible filtering, and a clear hierarchy so you can move from a high-level overview to operational details without losing clarity.
In logistics, analytics dashboards typically follow the flow of orders, assets, and costs through the system. In the table below, we outline the core metrics that logistics analytics dashboards usually track and explain what each tells you in practice.
| Metric | Explanation |
| Transportation & delivery metrics | |
| On-time delivery rate (OTD) | Percentage of orders delivered within the promised time window. Directly reflects service reliability. |
| On-time pickup | Share of shipments collected as scheduled. Early signal of upstream coordination issues. |
| Transit time | The average time shipments take to reach their destination. Helps identify route or carrier inefficiencies. |
| Route efficiency | Comparison of planned versus actual routes, distance, and duration. |
| Carrier performance | Reliability and consistency of external carriers or subcontractors. |
| Shipping volume | Number of active, completed, and delayed shipments over time. |
| Freight cost per unit, mile, or tonne | Transportation cost normalized for comparison and margin analysis. |
| Warehousing & inventory metrics | |
| Inventory turnover | How often inventory is sold and replenished within a period. |
| Inventory accuracy | Alignment between physical stock and system records. |
| Order picking accuracy | Percentage of orders picked without errors. |
| Warehouse turnaround time | Time required to receive, process, and ship goods. |
| Backlog and queue size | Volume of unprocessed orders or tasks waiting in the warehouse. |
| Storage utilization | How effectively is available warehouse space used? |
| Fleet and asset utilization metrics | |
| Vehicle utilization | Share of time vehicles are actively used versus idle. |
| Idle time | Periods when vehicles or drivers are available but inactive. |
| Fuel consumption | Fuel usage by route, vehicle, or time period. |
| Maintenance downtime | Time vehicles are unavailable due to maintenance or breakdowns. |
| Cost and financial impact metrics | |
| Cost per delivery | End-to-end cost of fulfilling a single order. |
| Penalty and surcharge costs | Financial impact of delays, SLA breaches, or contractual issues. |
| Margin by route or customer | Profitability linked to operational execution. |
Now, as you know what the value of analytics dashboards is, what their specifics are, and what metrics they track, it’s time to get to the practical side. We will explain what real business challenges they solve - all based on our completed projects.
Challenge 1. Lack of end-to-end operational visibility
In complex logistics environments, fragmented data across multiple departments and manual communication (such as phone calls and spreadsheets) make it nearly impossible to track a shipment’s lifecycle in real time.
How we solved it:
For UDK, we addressed this by building the WebOffice system, a centralized ERP platform that unified disparate data from accounting, warehouse, and delivery partners into a single interface. By implementing a comprehensive dashboard and an integrated system data structure, we replaced manual reconciliation with a "single source of truth." This provided real-time visibility into the entire flow, from order placement and automated carrier auctions to vehicle loading schedules and delivery tracking. This resulted in the elimination of 5+ phone calls per order and a $100,000 saving on delivery costs in the first year.
Challenge 2. Inefficient route planning
Traditional navigation apps often fail to account for commercial vehicle constraints (like low bridges) and provide no way for operators to monitor live fleet movements, leading to safety hazards and operational delays.
How we solved it:
For a UK technology company, we developed a route planning and live tracking solution that transformed static data into an interactive analytics dashboard for operators. By integrating Azure Maps with real-time data from a custom-built mobile app, we enabled operators to visualize the entire fleet on a live map, manage route hazards, and ensure drivers were on safe, vehicle-specific paths (e.g., avoiding low bridges for double-decker buses). The dashboard solved the visibility gap by providing role-based access, allowing administrators, operators, and managers to monitor live locations, active drivers, and route congestion from a single, centralized web platform.
Challenge 3: Inefficient dispatching and lack of order traceability
Manual order management involving physical office visits and constant phone calls leads to massive time wastage, frequent misunderstandings, and a "reporting nightmare" where completed work cannot be accurately tracked or audited.
How we solved it: For a Denver-based waste transportation company, we developed a comprehensive fleet management platform that replaced manual chaos with a high-performance dispatcher’s console (analytics dashboard) and a synced mobile app for drivers. By centralizing data, we enabled dispatchers to assign work orders digitally and track their status in real-time, eliminating the need for drivers to return to the office for new tasks. The dashboard solved the traceability challenge by automatically generating detailed reports on driver performance, completed orders, and used routes, providing full transparency into the fleet’s operations and significantly streamlining the accounting process.
At Clockwise, we divide the development process into 3 major chunks: discovery, development itself, and post-launch maintenance. Below, we will reveal each of them in detail.
The discovery phase is a preliminary stage of development where we translate your logistics business goals into a concrete technical roadmap and validated visual prototypes.
Why start with discovery?
How we run discovery
Step 1: Scope clarification & data audit
We map out your current logistics workflows and audit your existing data sources (TMS, ERP, IoT sensors), and define the core modules, such as real-time tracking, automated reporting, or carrier auctions.
Step 2: Defining data pipelines & tech approach
Our architect designs the "under the hood" logic. This means defining how data flows and choosing the right visualization tech (like Mapbox or Deck.gl) to handle thousands of moving markers without lag.
Step 3: UI/UX wireframing & prototyping
We design low-fidelity wireframes followed by high-fidelity clickable prototypes, ensuring a dispatcher can identify a delayed shipment or a route hazard within seconds of looking at the dashboard.
Step 4: Integration & risk mitigation planning
We investigate third-party APIs (e.g., ELD providers, weather services, or SMS gateways) and create a risk register. This is where we plan for edge cases, such as "what happens if a driver enters a tunnel and loses GPS signal?"
Step 5: Planning & final estimate
With the final scope in hand, our PM, developers, and QA engineers collaborate to create realistic estimates. We convert these development hours into a final budget and break the project down into 2-4-week sprints to provide a clear timeline of what will be built and when.
Discovery deliverables
The number and type of deliverables you will get when discovery ends depends on your project’s complexity and goals. We offer 3 tailored discovery packages to ensure you only pay for the depth of planning you need:
| Package | Key deliverables |
| Small (3–5 weeks)
Best for simple dashboard concepts From $12,000 |
WBS, requirements, wireframes + UI concept, risk register, and cost/timeline estimates. |
| Medium (5–7 weeks)
Ideal for custom ERP modules or multi-role platforms From $16,000 |
Everything in Small, plus non-functional Requirements, clickable prototype, and a detailed architecture diagram. |
| Large (8–10 weeks)
For complex, global logistics ecosystems From $25,000 |
Everything in Medium, plus a roles & permissions matrix, a full UI kit/design system, analysis of third-party APIs, and a multi-year product roadmap. |
Once discovery is finalized, we transition into the active development phase.
1. Technical infrastructure & DevOps setup
First, we establish the backbone of the project. This involves setting up version control repositories to track every code change and configuring dedicated development and staging environments. We also implement (CI/CD) pipelines to automate testing and delivery, ensuring that new updates can be rolled out frequently and safely without disrupting the existing system.
2. Iterative development & testing
This is the core phase where we focus on delivering fully functional features in short cycles to allow for constant feedback and adjustments.
3. Data migration & integrations
Here, we begin the data-heavy work:
4. Regression & stabilization
Once all features are developed, we focus on the platform's overall integrity:
5. User acceptance testing (UAT)
This is where you and your team take the lead to test the platform in real-world scenarios to ensure it meets your operational needs. Then, we take your feedback to make final adjustments, ensuring the dashboard feels right for your dispatchers and managers.
6. Deployment
Finally, we set up the platform for live production. Following the official launch, we perform a final round of checks to confirm everything is running perfectly in your live environment.
Once the platform is live, we transition into a proactive maintenance phase focused on long-term stability and high performance.
At Clockwise, we offer 3 distinct engagement models tailored to your internal resources and the specific requirements of your logistics data project:
| Model | Core focus | Explanation |
| End-to-end product development | Turning an idea into a complete, ready-to-launch product. | Covers the full software lifecycle: research, design, development, testing, and release while we manage execution. |
| Dedicated development team | Providing a handpicked team that works as an extension of your in-house staff | Ensures steady progress for ongoing scaling or system expansion |
| Product discovery | Defining the product direction and technical roadmap before development starts | Validates ideas and prioritizes features to result in a clear scope, timeline, and budget while minimizing risks |
Implementing high-quality analytics dashboards is the most effective way to transform logistics data into a powerful tool for operational growth. By centralizing visibility, automating complex route planning, and tracking the right KPIs, your businesses can move from troubleshooting to management. Whether you need a large-scale product or a targeted solution, choosing the right development partner ensures your dashboard evolves alongside your operational challenges. At Clockwise, we stand ready to help you navigate this journey through a proven process that helps our clients cut delivery costs by 30% and route-planning time by 40%.