AI solutions
What we do
Services
Experts in
How we work


Along with collecting data provided by social media platforms, this digital marketing tool uses machine learning algorithms to predict user demographics and behavior.
The Sparrow app gathers data from various sources and lets users create marketing reports and shareable presentations. The service currently pulls data from Facebook, Instagram, and Twitter, but the team is adding integrations with new platforms every month.

The development team behind this marketing software consisted of the founder, a frontend developer, two backend developers, a designer, and a machine learning engineer.
The Sparrow team invested all available resources into developing marketing software functionality. Since exquisite design wasn’t their first priority, the UI was the app’s weak point. Right off the bat, users would notice the basic chart design.
So the Sparrow team decided to start redesigning their marketing automation tool by updating the chart layout. To do this, they looked for external data visualization experts.
Having successful D3.js projects in our portfolio and Sparrow Charts working with tech startups that have successfully completed the seed roundof investments, Clockwise Software was able to meet the needs of Sparrow Charts.

Initially, Clockwise Software team was hired to work on data visualization. Our first task was to implement the new chart layout according to provided design mockups.
As the core Sparrow team was satisfied with our proficiency in frontend development, they decided to delegate us the app's UI update.
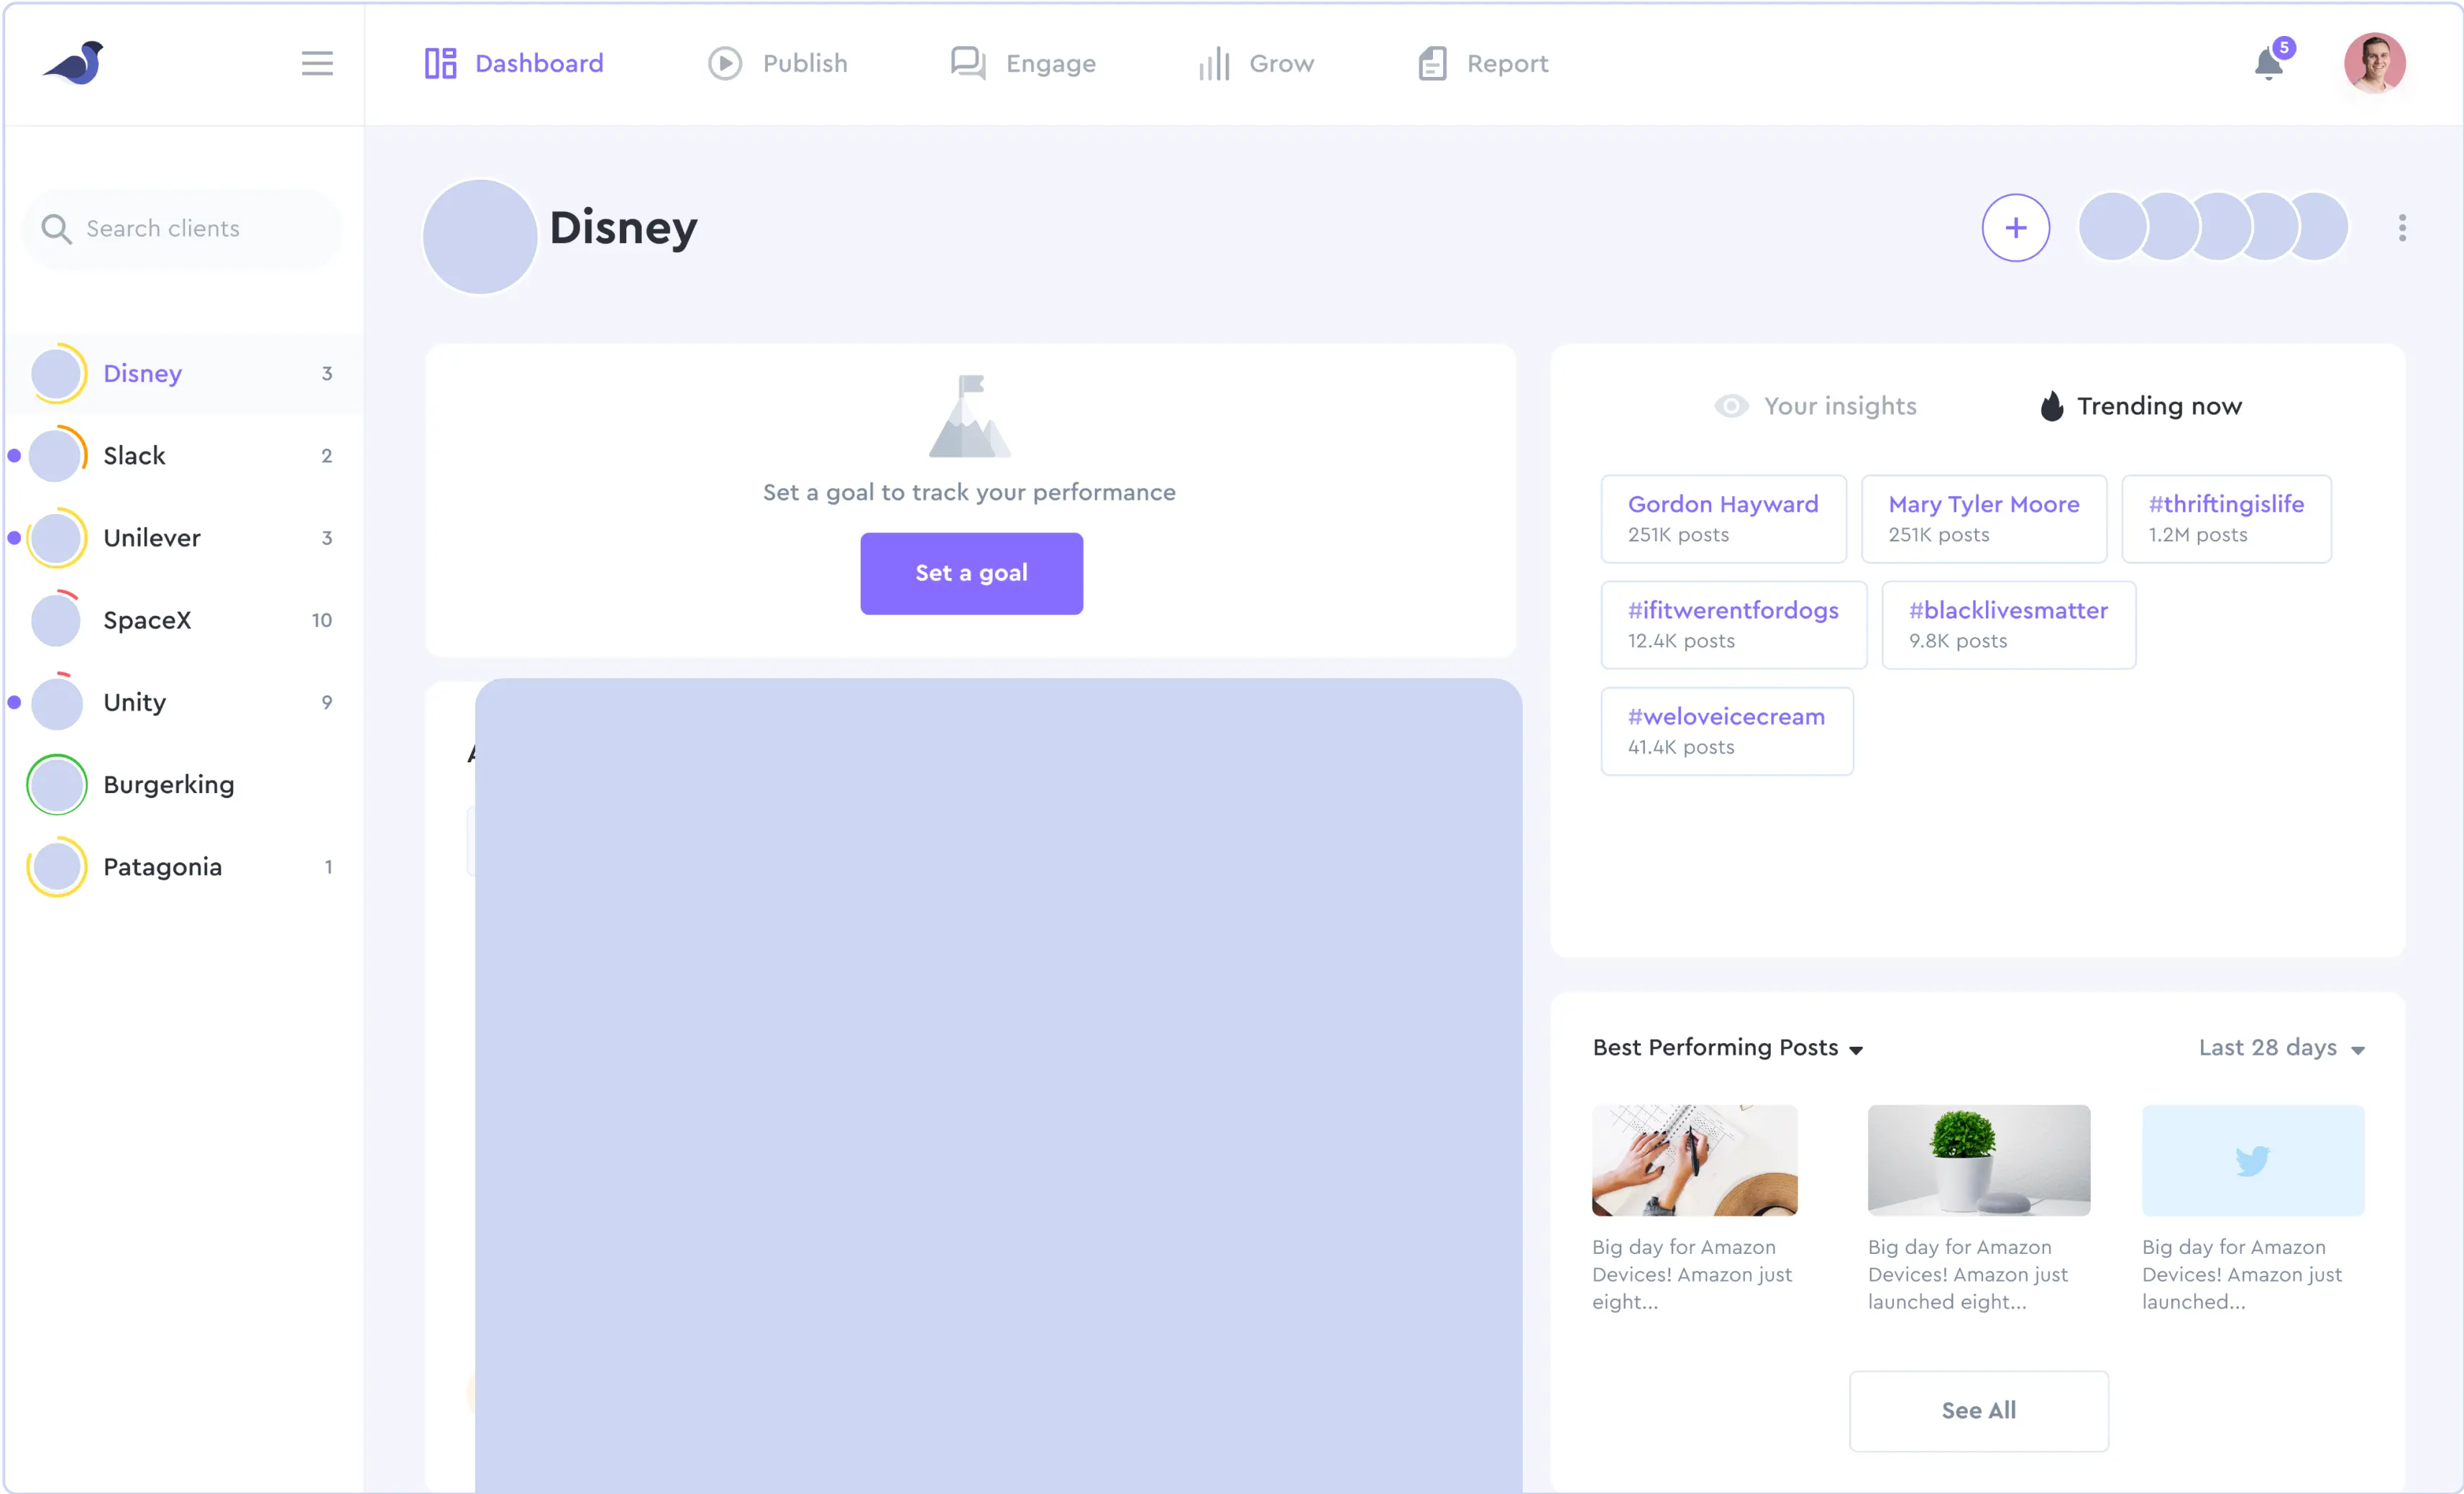


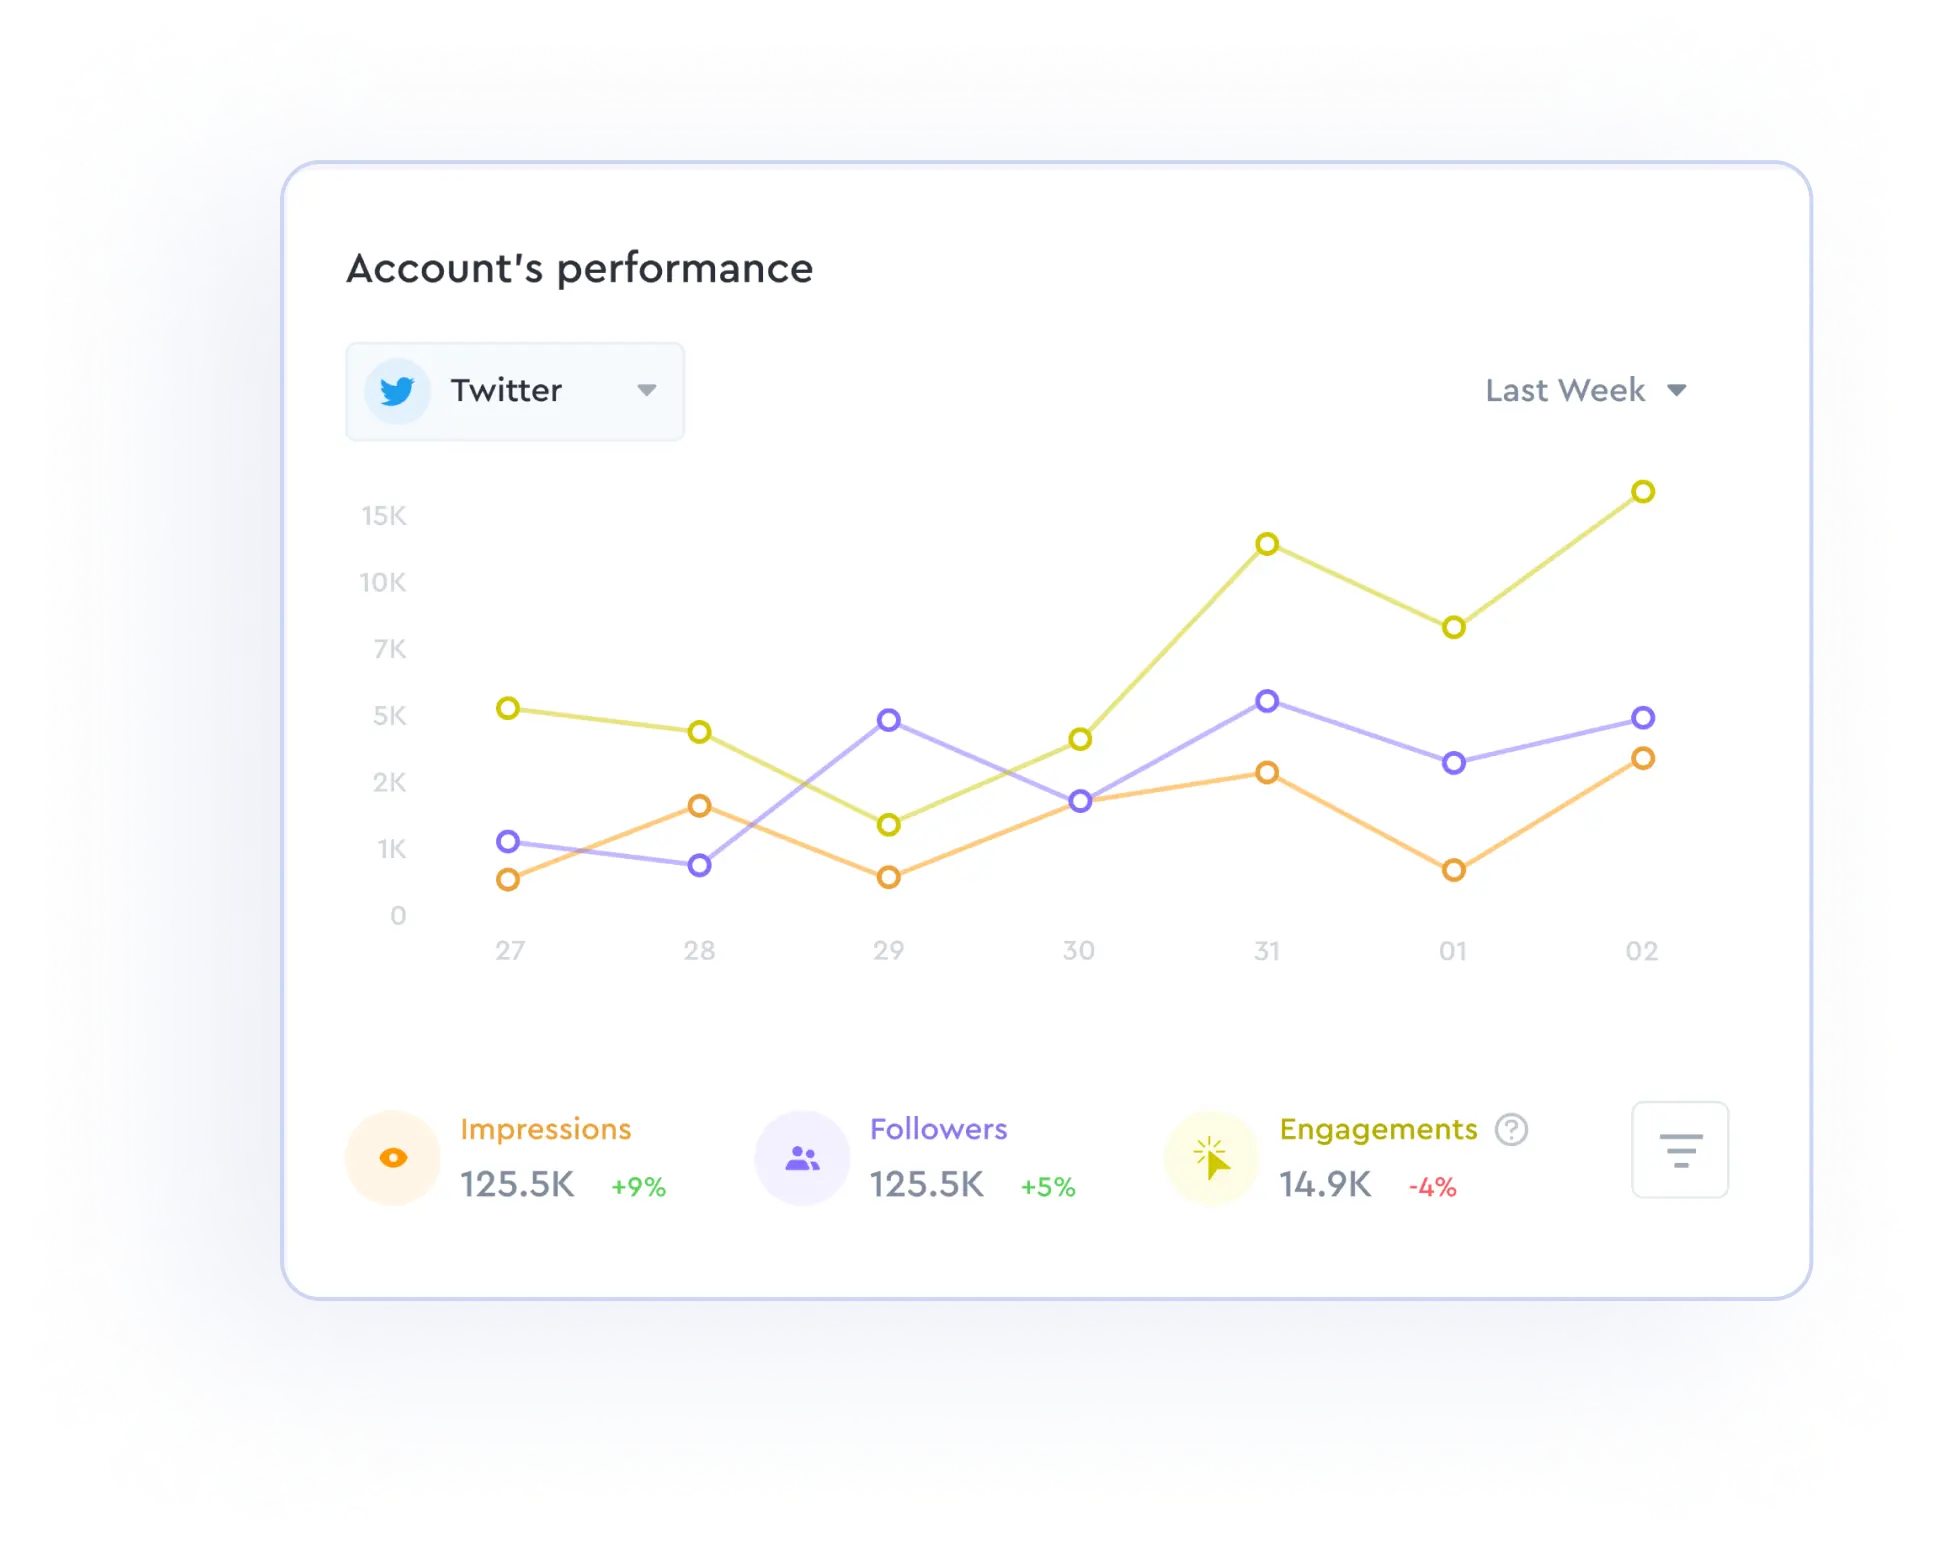
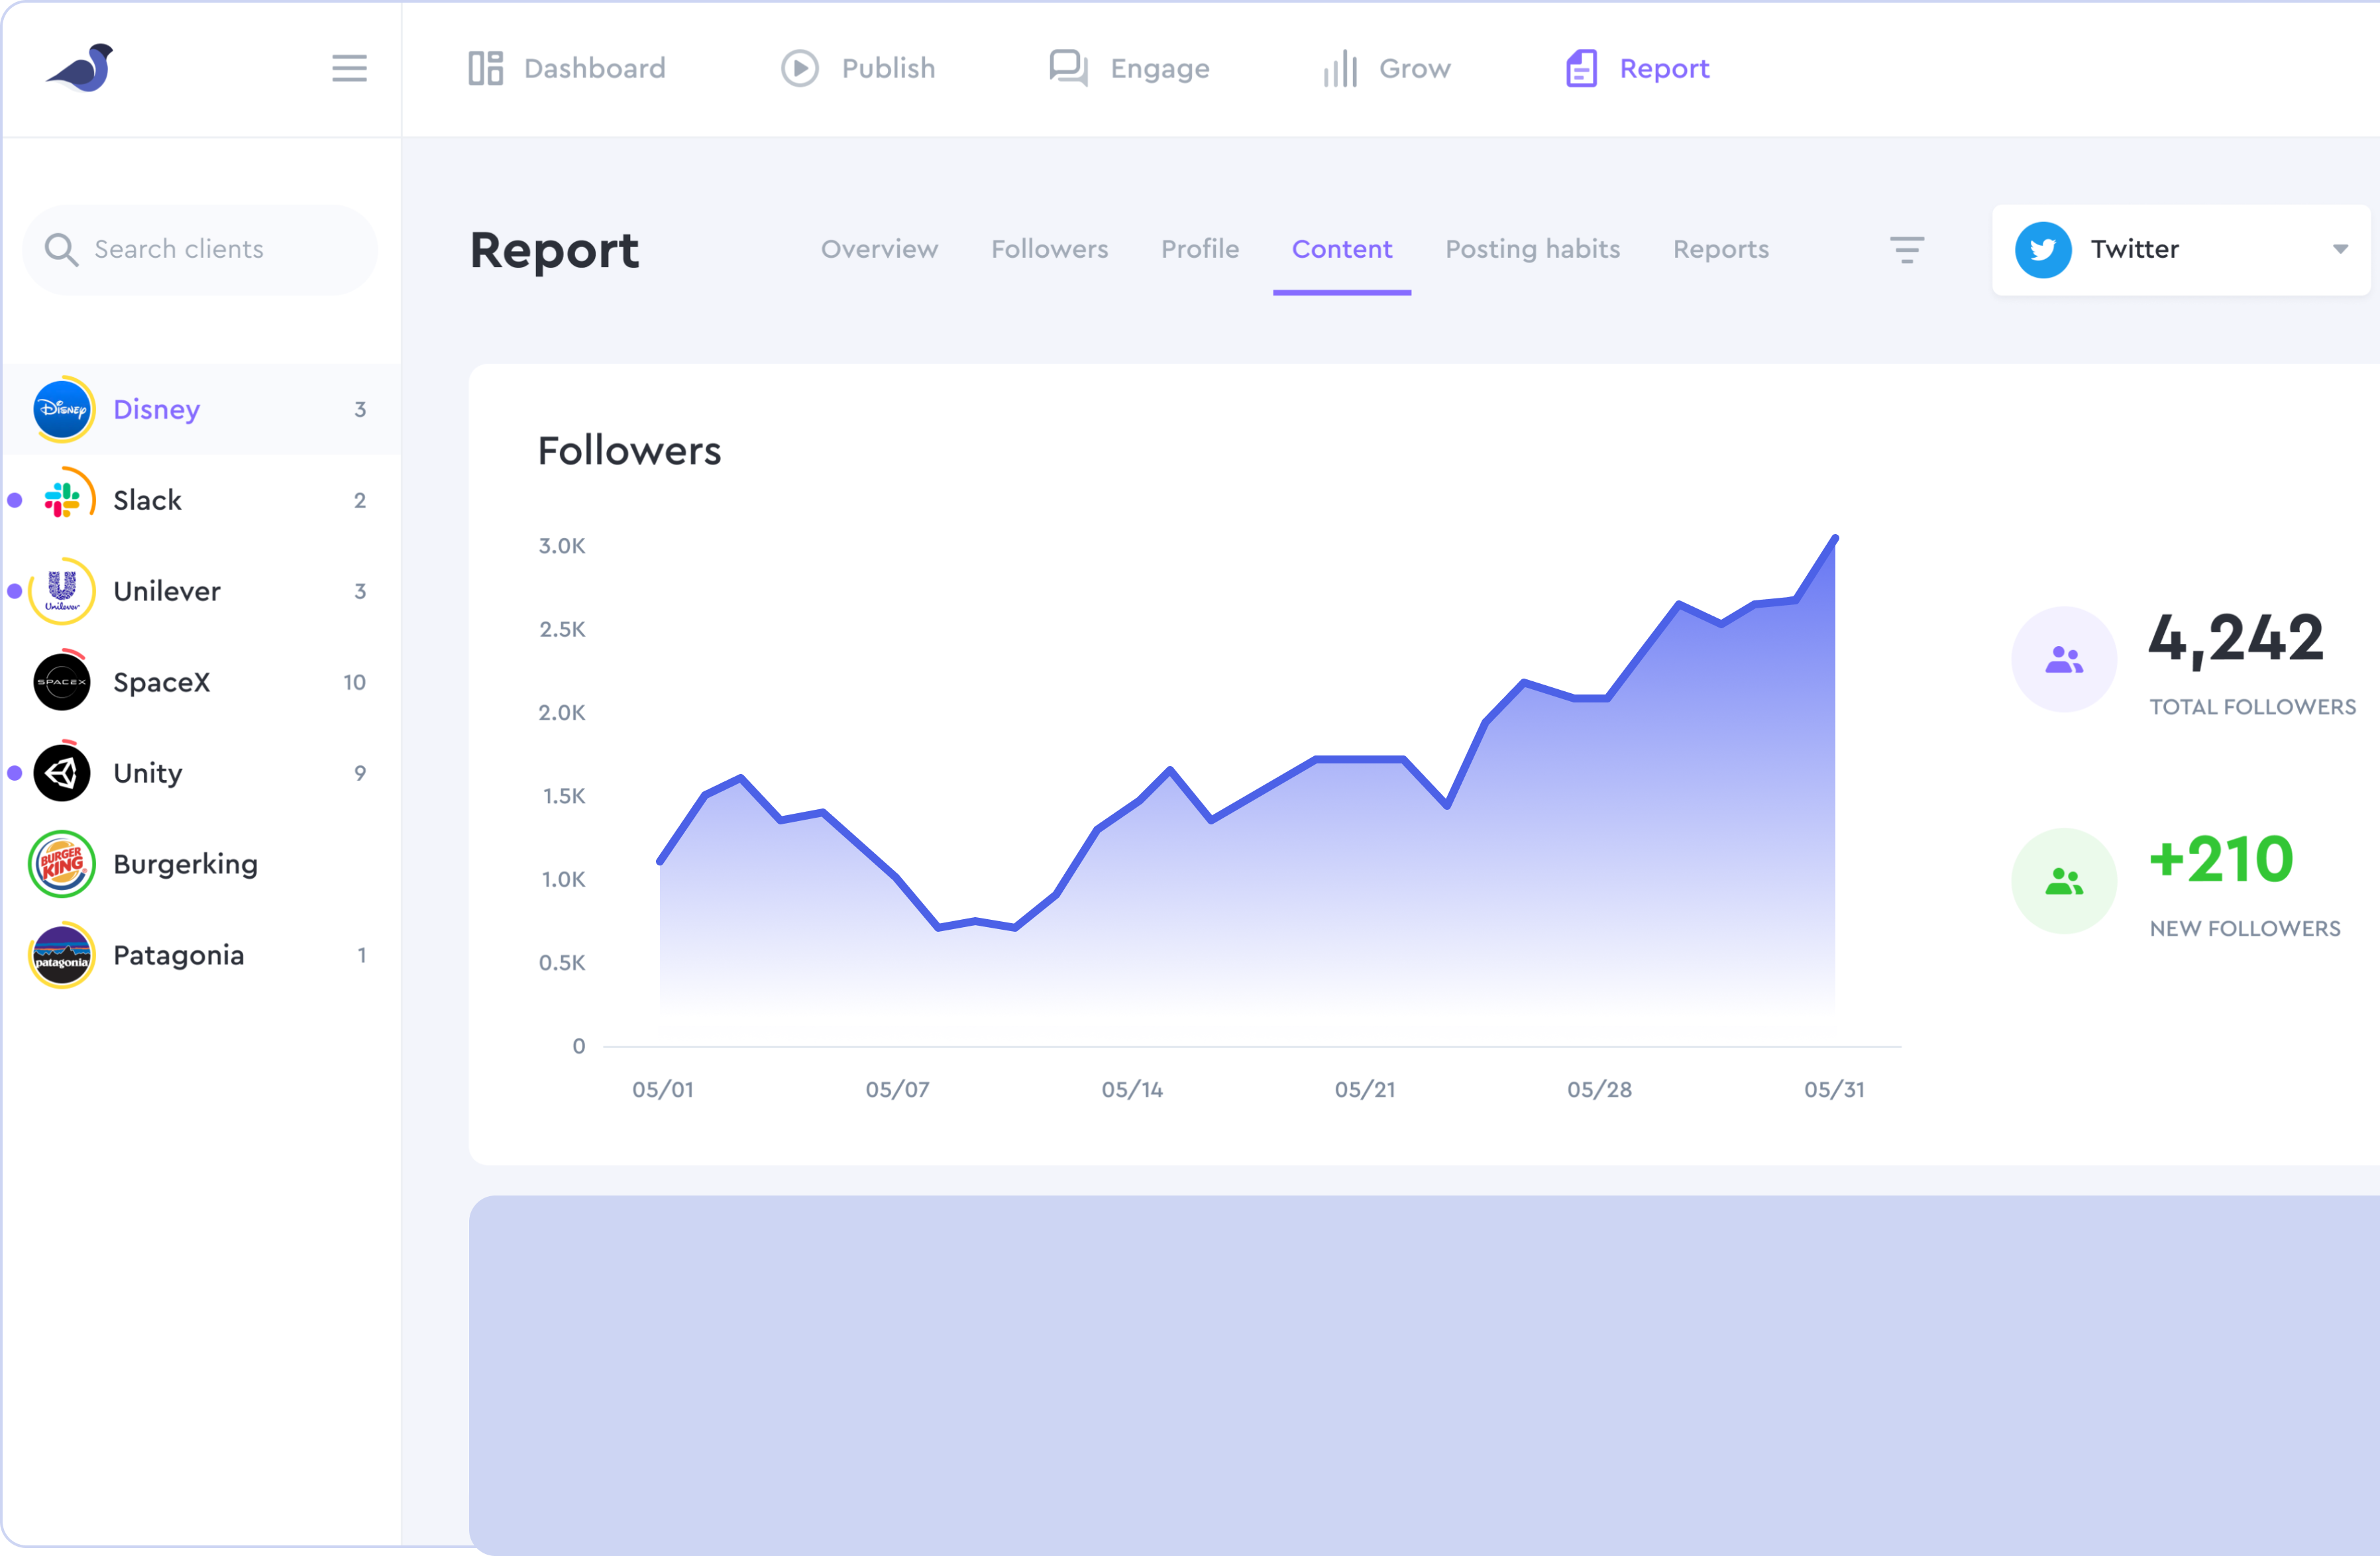
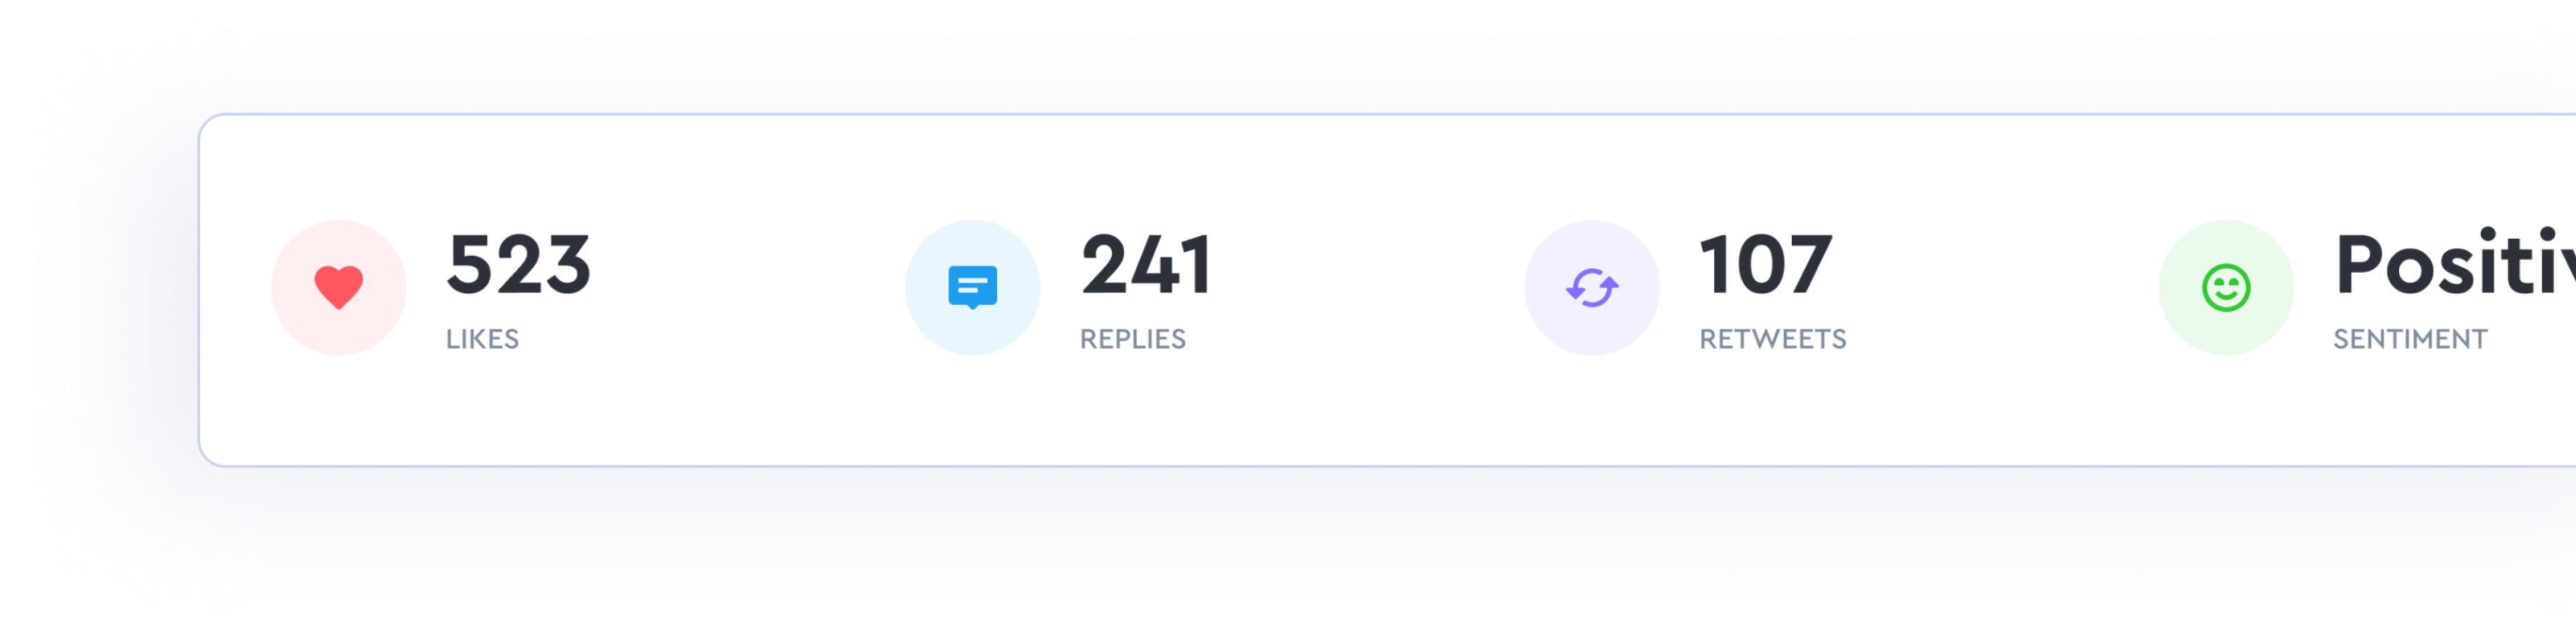
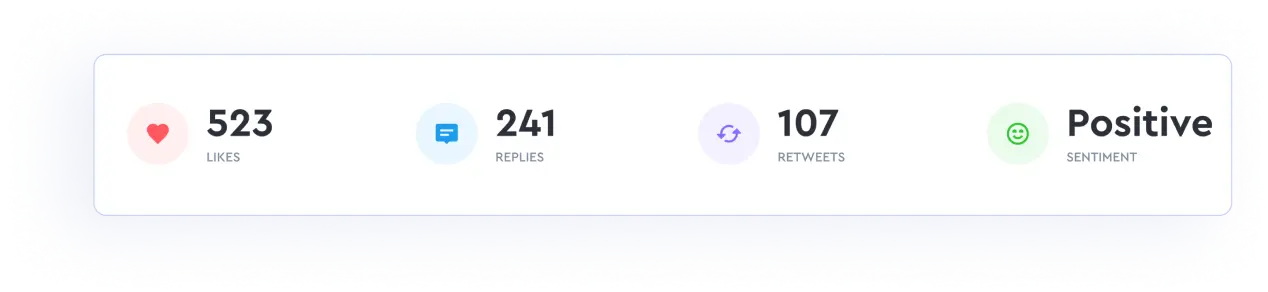
These charts received updated designs, new animations, and expanded functionality. Now, users can create marketing reports with various metrics such as likes, comments, subscriber count dynamics, subscriber ages and genders, and the best time for posting. All charts are stored in a dedicated “Storybook” repository.
As a result, marketing campaign reports are shared across the web application and PDF reports.
We implemented a constructor in which users can fully customize reports and export them as PDF files. Marketing reports are generated on the back end using Puppeteer — a Node.js library emulating web browser functionality on the server.
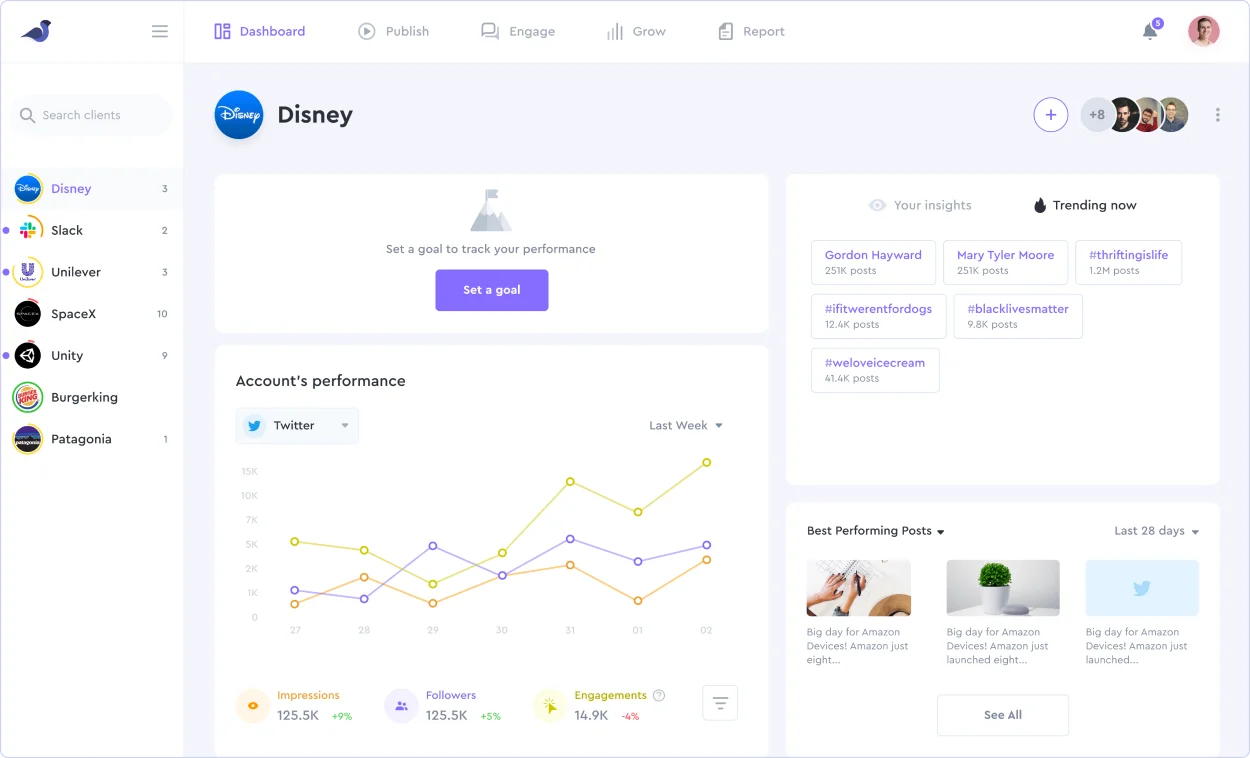
Users can adjust the Sparrow work environment according to their current requirements, removing unneeded features and repositioning the most frequently used features. The latest React update introduced custom hooks, offering the ability to set certain logic in a function and reuse it throughout the project. With React Hooks, we made the UI fully customizable.
At Sparrow, we visualize a lot of data. That’s essentially a big part of our product. While we’ve created some really awesome charts, we had a simple animation issue where new data would cause the whole chart to re-render.
To solve this problem, I asked one of my engineering contractors from Clockwise, if there was an easy way to make the lines/bars just move to the new position on the graph when a new data set was selected. He said he’d play around with the idea in between other important tasks.
Two weeks after the initial ask, the developer wanted to share what he came up with in our team sync, and simply put, we were all blown away... The frontend developer came up with his own inspiration for an animation and decided to go with it.
After the successful beta testing, Sparrow added the integration with Google workspace to remove even more bottlenecks in marketers’ daily routine. It was the fourth pivot for the team and they finally started to find traction in the market. The product has attracted more than 1500 users as for March 2022. This is only the first of the coming milestones.